
chart() provides a unified interface for base plots, lattice and ggplot2.
chart(data, ..., type = NULL, env = parent.frame())

# Default S3 method
chart(
  data,
  specif = NULL,
  formula = NULL,
  mapping = NULL,
  ...,
  type = NULL,
  auto.labs = TRUE,
  env = parent.frame()
)

# S3 method for class '`function`'
chart(data, ..., type = NULL, auto.labs = TRUE, env = parent.frame())
Arguments
- data
The dataset (a
data.frameortibble, usually).- ...
Further arguments.
- type
The type of plot to produce.
- env
The environment where to evaluated the formula.
- specif
Specification, being either
aes(), or a formula.- formula
A formula.
- mapping
- auto.labs
Are labels (and units) automatically used for axes?
Details
....
Examples
urchin <- data.io::read("urchin_bio", package = "data.io", lang = "en")
# base R graphics
hist(urchin$height)
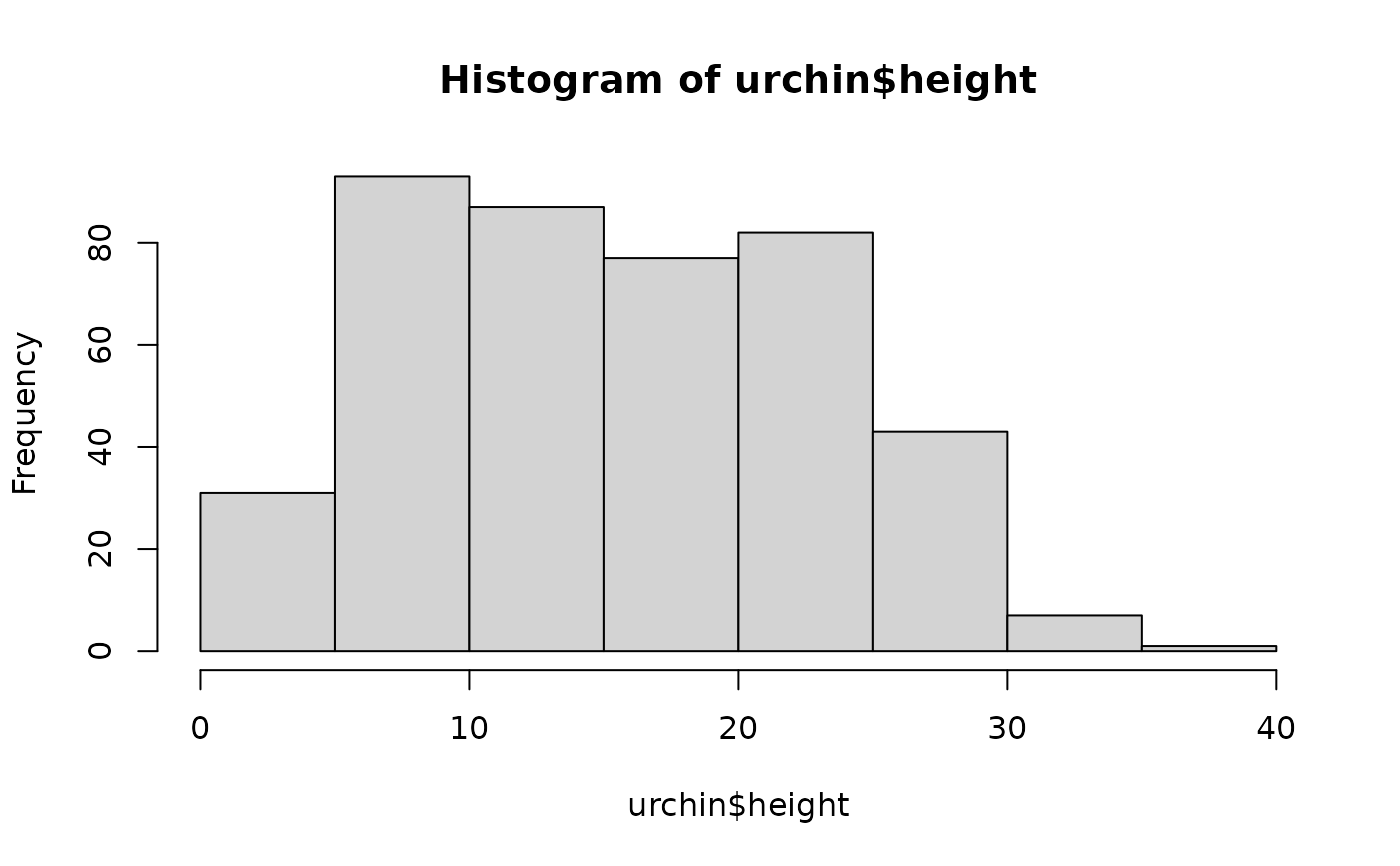 # ... translates to:
chart(function() hist(urchin$height))
# ... translates to:
chart(function() hist(urchin$height))
 # ... or if the expression is provided directly, specify it is a base chart
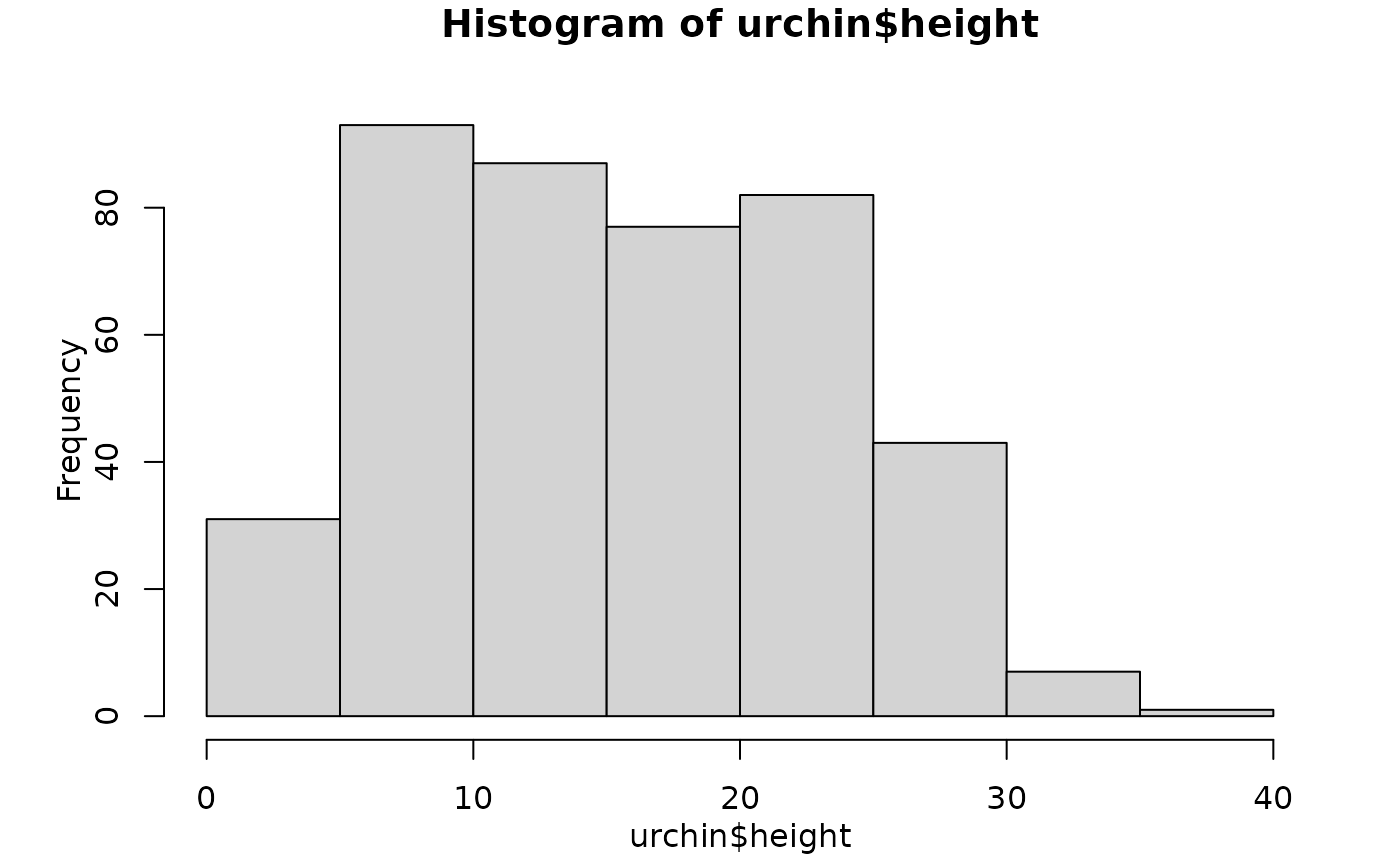
chart(hist(urchin$height), type = "base")
# ... or if the expression is provided directly, specify it is a base chart
chart(hist(urchin$height), type = "base")

 # ... or more concisely:
chart$base(hist(urchin$height))
#> Error in chart.default(type = name, ...): It seems no plot was generated with this code
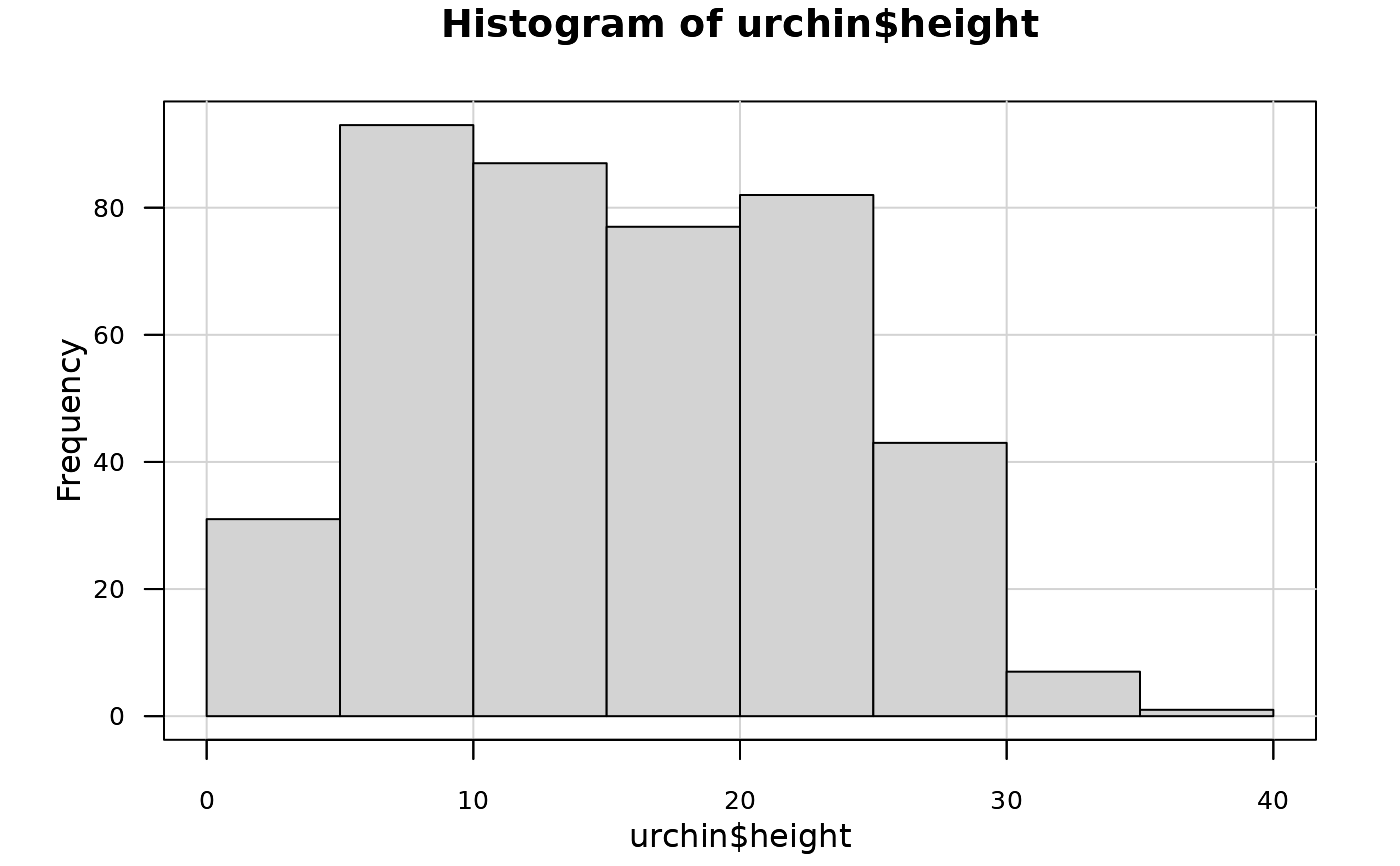
# A lattice plot
histogram(~ height, data = urchin)
chart$histogram(urchin, ~ height)
# ggplot2 histogram
ggplot(urchin, aes(height)) + geom_histogram()
#> `stat_bin()` using `bins = 30`. Pick better value `binwidth`.
#... or with chart (notice similarities with lattice version)
chart(urchin, ~ height) + geom_histogram()
#> `stat_bin()` using `bins = 30`. Pick better value `binwidth`.
#chart$geom_histogram(urchin, ~ height)
# ... or more concisely:
chart$base(hist(urchin$height))
#> Error in chart.default(type = name, ...): It seems no plot was generated with this code
# A lattice plot
histogram(~ height, data = urchin)
chart$histogram(urchin, ~ height)
# ggplot2 histogram
ggplot(urchin, aes(height)) + geom_histogram()
#> `stat_bin()` using `bins = 30`. Pick better value `binwidth`.
#... or with chart (notice similarities with lattice version)
chart(urchin, ~ height) + geom_histogram()
#> `stat_bin()` using `bins = 30`. Pick better value `binwidth`.
#chart$geom_histogram(urchin, ~ height)