Add a circle in a base R plot, given its center (x and y coordinates) and its diameter. In {exploreit}, this function can be used to cut a circular dendrogram, see example.
circle(x = 0, y = 0, d = 1, col = 0, lwd = 1, lty = 1, ...)Arguments
- x
The x coordinate of the center of the circle.
- y
The y coordinate of the center of the circle.
- d
The diameter of the circle.
- col
The color of the border of the circle.
- lwd
The width of the circle border.
- lty
The line type to use to draw the circle.
- ...
More arguments passed to
symbols().
Value
This function returns NULL. It is invoked for it side effect of
adding a circle in a base R plot.
See also
Examples
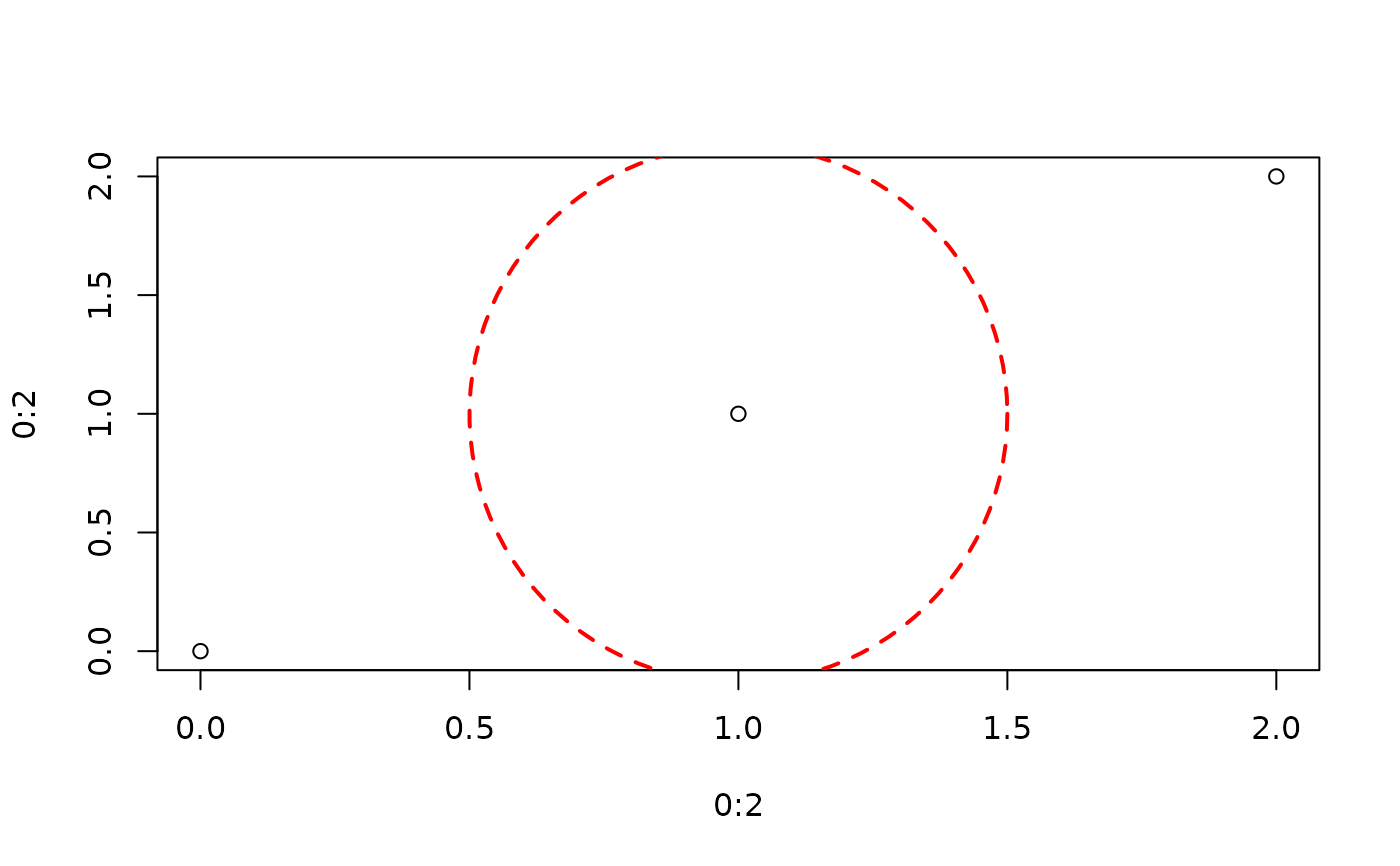
plot(x = 0:2, y = 0:2)
circle(x = 1, y = 1, d = 1, col = "red", lwd = 2, lty = 2)