Transforming an nls model into a function could be useful to plot or otherwise manipulate it, see examples.
# S3 method for class 'nls'
as.function(x, ...)Value
A function with argument x that returns the values predicted by the
model for these values of x.
Examples
data("ChickWeight", package = "datasets")
chick1 <- ChickWeight[ChickWeight$Chick == 1, ]
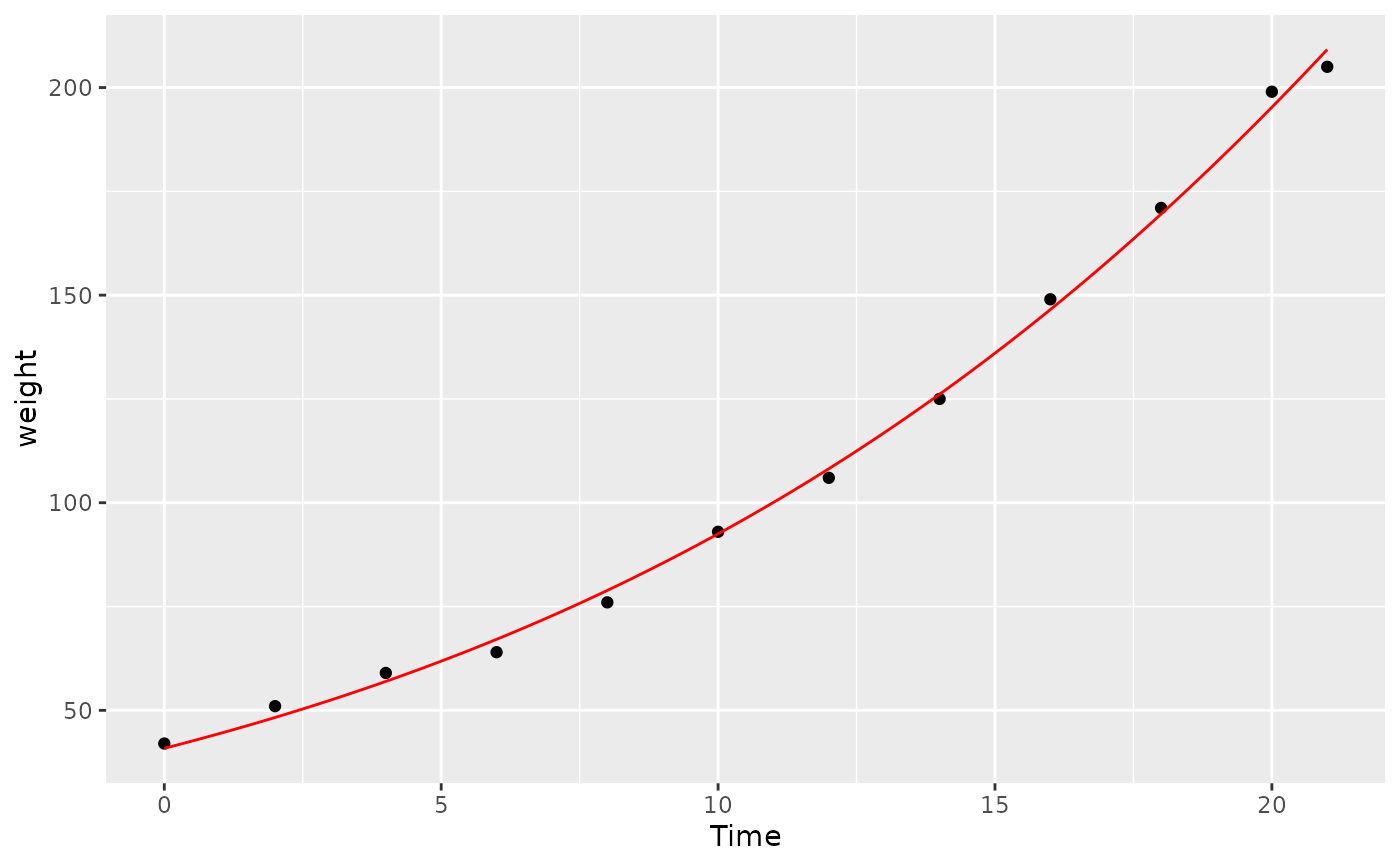
# Adjust a logistic curve
chick1_logis <- nls(weight ~ SSlogis(Time, Asym, xmid, scal), data = chick1)
# Show this on a ggplot
library(ggplot2)
p <- ggplot(chick1, aes(x = Time, y = weight)) +
geom_point() +
stat_function(fun = as.function(chick1_logis), col = "red")
p
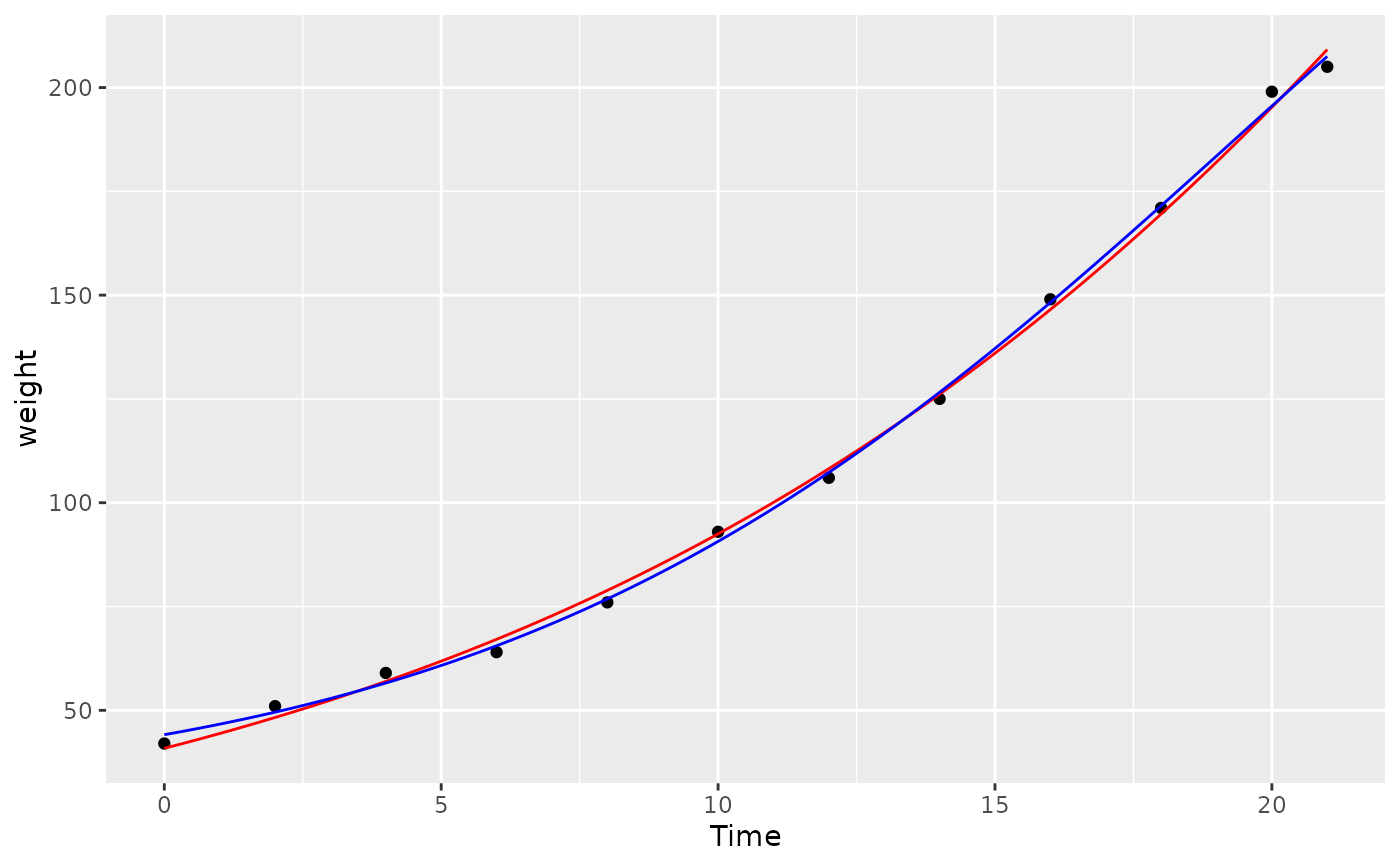
 # Visually compare with another model (four-parameter logistic):
chick1_fpl <- nls(weight ~ SSfpl(Time, A, B, xmid, scal), data = chick1)
p + stat_function(fun = as.function(chick1_fpl), col = "blue")
# Visually compare with another model (four-parameter logistic):
chick1_fpl <- nls(weight ~ SSfpl(Time, A, B, xmid, scal), data = chick1)
p + stat_function(fun = as.function(chick1_fpl), col = "blue")