
Plot vectors inside a unit circle (PCA loadings or correlations plots).
Source:R/vectorplot.R
vectorplot.RdPlots vectors with 0 < norms < 1 inside a circle. These plots are mainly designed to represent variables in principal components space for PCAs.
vectorplot(x, ...)

# Default S3 method
vectorplot(
  x,
  y,
  col = par("col"),
  circle.col = "gray",
  ar.length = 0.1,
  pos = NULL,
  cex = par("cex"),
  labels = NULL,
  ...
)

# S3 method for class 'loadings'
vectorplot(
  x,
  choices = 1L:2L,
  col = par("col"),
  circle.col = "gray",
  ar.length = 0.1,
  pos = NULL,
  cex = par("cex"),
  labels = rownames(x),
  main = deparse(substitute(x)),
  ...
)

# S3 method for class 'Correlation'
vectorplot(
  x,
  choices = 1L:2L,
  col = par("col"),
  circle.col = "gray",
  ar.length = 0.1,
  pos = NULL,
  cex = par("cex"),
  labels = rownames(x),
  main = deparse(substitute(x)),
  ...
)
Arguments
- x
An object that has a
vectorplot()method, like 'loadings' or 'correlation', or a numeric vector with 0 < values < 1.- ...
Further arguments passed to plot functions.
- y
A numeric vector with 0 < values < 1 of same length as `x.
- col
Color of the arrows and labels.
- circle.col
The color for the circle around the vector plot.
- ar.length
The length of the arrows.
- pos
The position of text relative to arrows. If
NULL, a suitable position is calculated according to the direction where the arrows are pointing.- cex
The factor of expansion for labels in the graph.
- labels
The labels to draw near the arrows.
- choices
A vector of two integers indicating the axes to plot.
- main
The title of the plot.
Value
The object 'x' is returned invisibly. These functions are called for their side-effect of drawing a vector plot.
See also
Examples
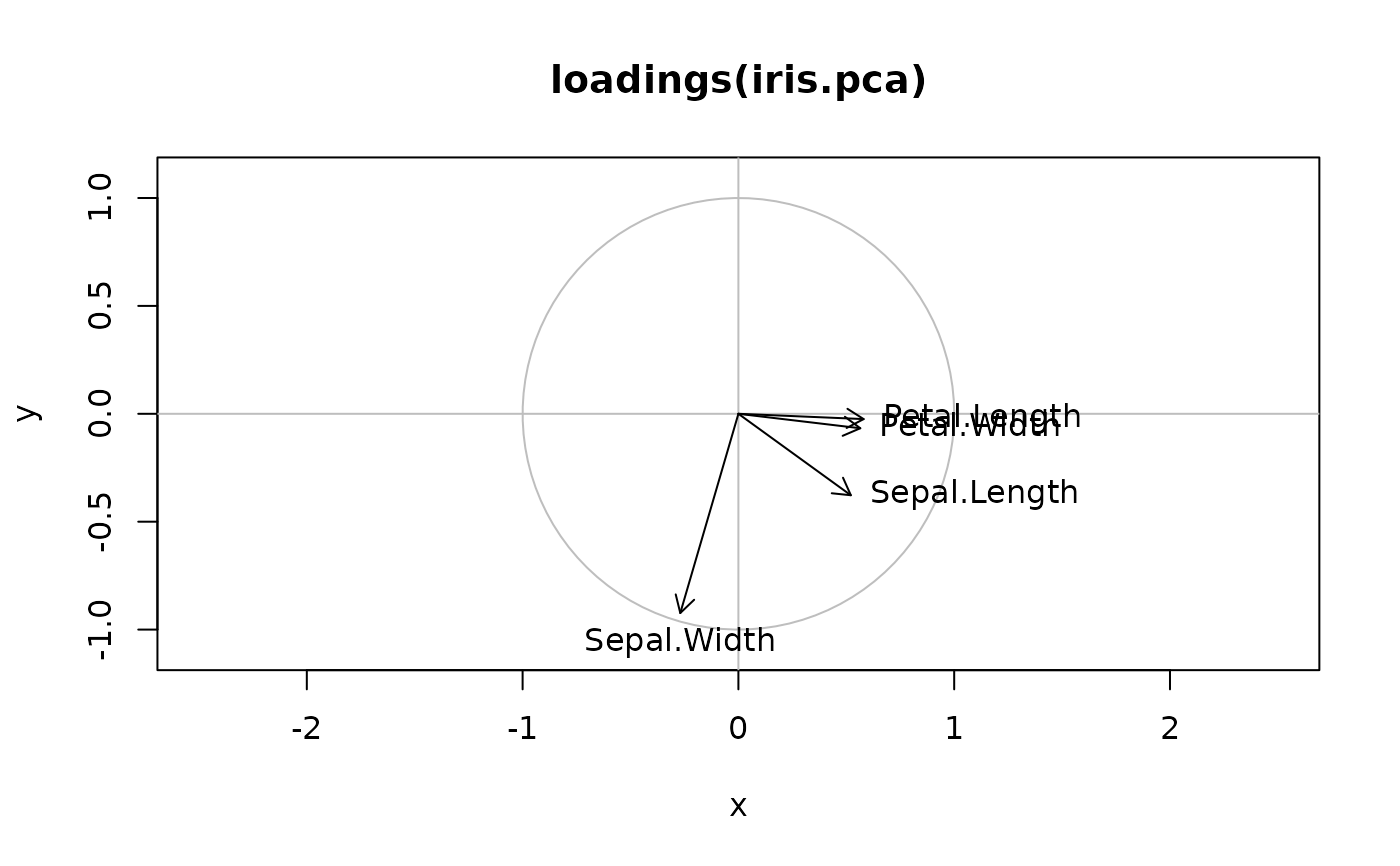
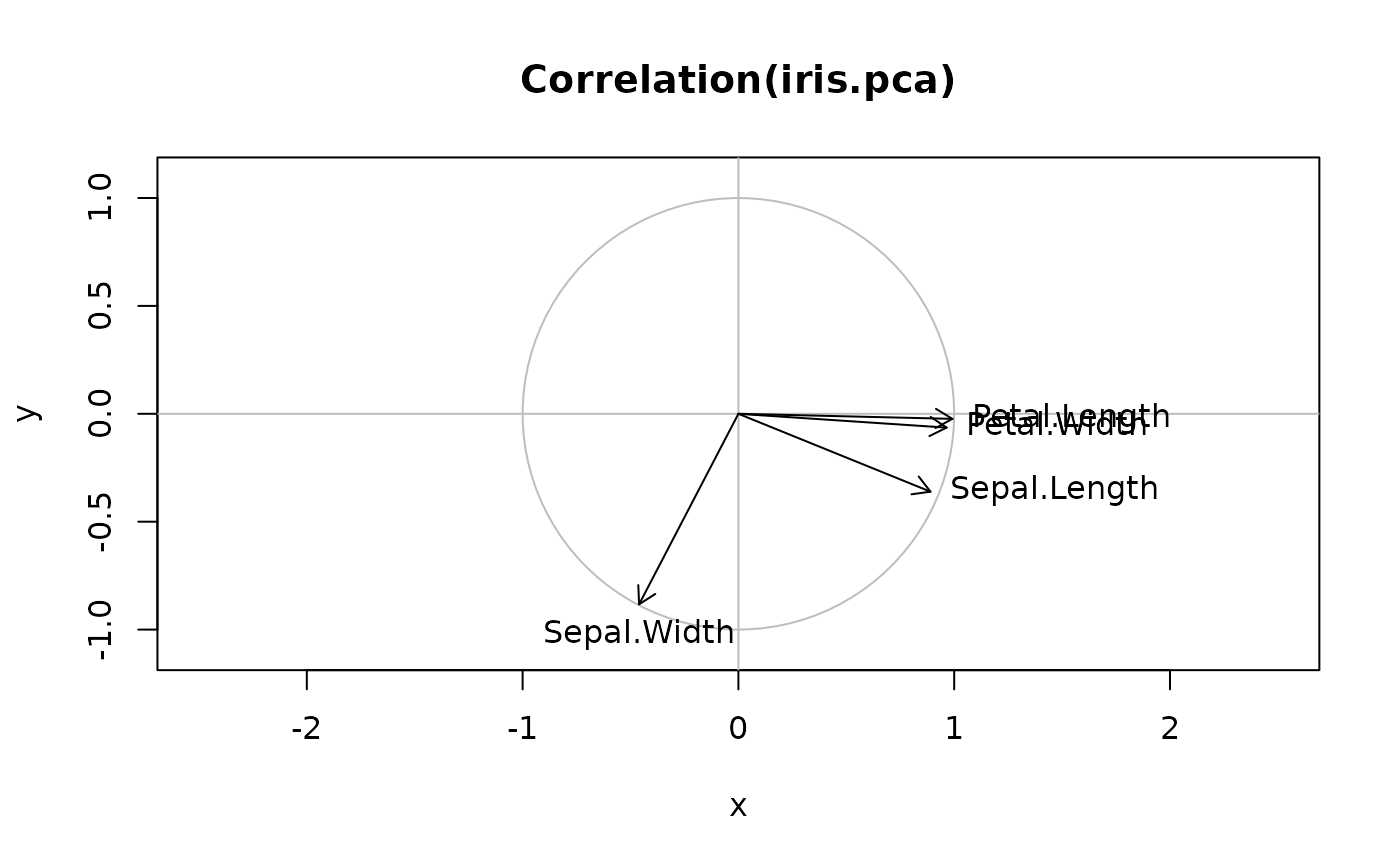
# Create a PCA and plot loadings and correlations
iris.pca <- pcomp(iris[, -5])
vectorplot(loadings(iris.pca))

vectorplot(Correlation(iris.pca))

# Note: on screen devices, change aspect ratio of the graph by resizing
# the window to reveal cropped labels...
# Note: on screen devices, change aspect ratio of the graph by resizing
# the window to reveal cropped labels...