
A 'geoshapes' object containing one or more georeferenced shapes
geoshapes.RdGeoshapes objects contain one or more shapes (that is, polygons, points, or polylines) defined by their longitude and latitude in decimal degrees. These objects can be read or write to ERSI shape files.
geoshapes(x, name = "1", dbf = NULL)
read.geoshapes(shpFile, dbf = TRUE)
write.geoshapes(x, file, type = c("polygon", "point", "polyLine"),
    dbf = TRUE, arcgis = FALSE,...)

# S3 method for class 'geoshapes'
print(x, ...)
# S3 method for class 'geoshapes'
lines(x, which = 1, ...)
# S3 method for class 'geoshapes'
points(x, which = "all", ...)
Arguments
- x
A data frame with columns 'x' and 'y' for longitudes and latitudes of the points in decimal degrees, or a list of such data frames for
geoshapes(); a 'geoshapes' object for the other functions- name
The name to use for the shape in case a data frame is passed to
geoshapes(). Ignored if a list is passed to the function- dbf
A data frame to record as 'dbf' attribute for
geoshapes, or a flag indicating to read or write DBF data too, if the file exists- shpFile
The path to a .shp file (ESRI shape file) to import
- file
The path to an ESRI file where to write data, without extension. Three files are created, with respective extensions .shp, .shx, and .dbf
- type
The type of shape to write in the ESRI shape file
- arcgis
If
TRUE, the header of the DBF table is made compatible with ArcGIS, that is, dot (.) is replaced by underline (_)- which
The index of the shape to use, or its name
- ...
Further arguments passed to the functions (not used yet)
Details
geoshapes() converts a data frame or a list into a 'geoshapes' object.
read.geoshapes() and write.geoshapes() read and write shapes
from or to ESRI shape files on disk.
The 'geoshapes' objects have methods to print them (very concisely), and to
add them to graphs, as polygons lines(), or as separate points
points().
Value
A 'geoshapes' object is returned from geoshapes() and
read.geoshapes(). The other functions are used for their side-effect
rather than for returning something useful.
Examples
data(mbord) # Morocco borders
mbord
#> A 'geoshapes' object containing one shape
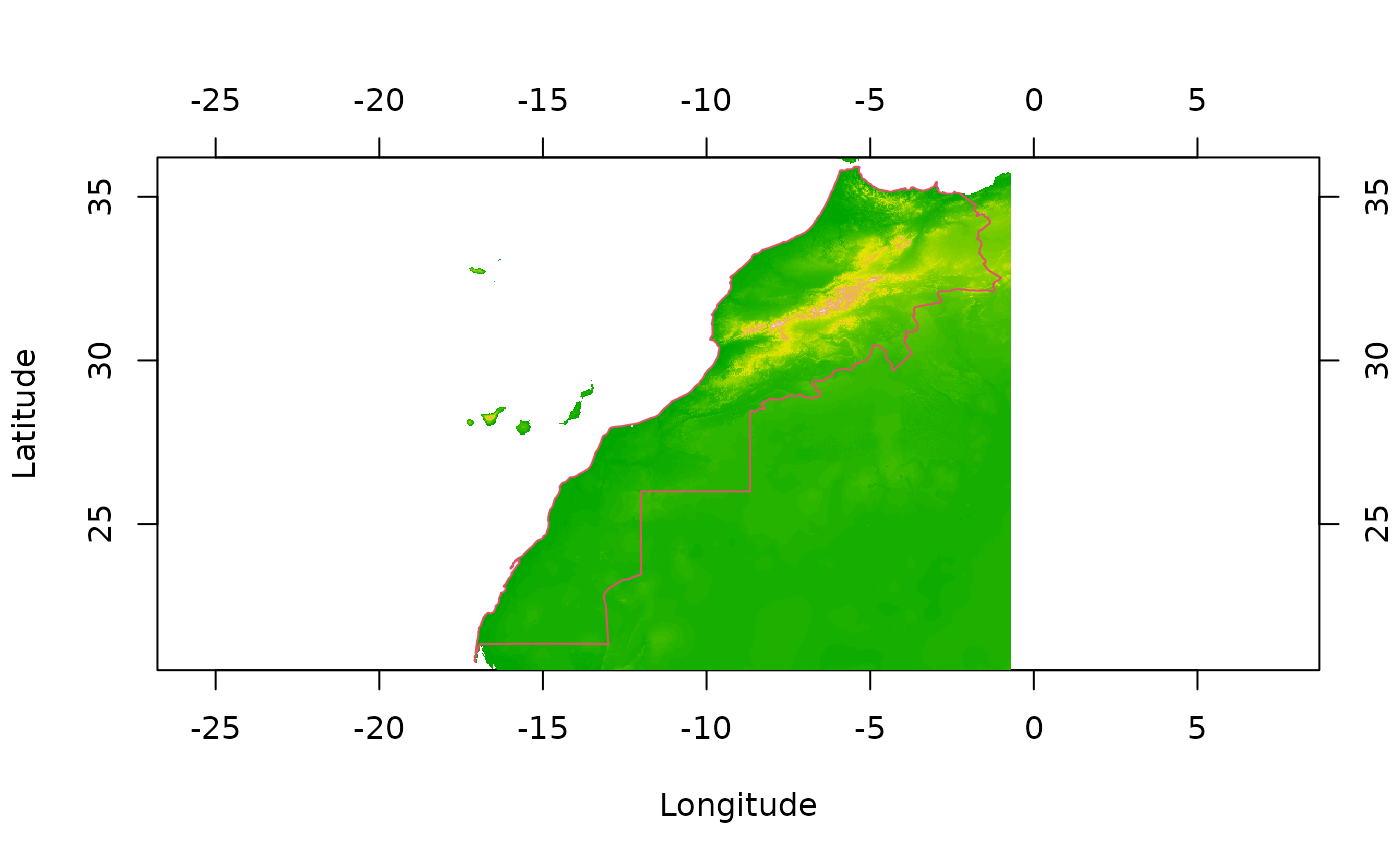
# Plot of Morocco terrain and add the borders in red
data(morocco)
image(morocco)
lines(mbord, col = 2)
 # Simulate the creation of a geoshapes object with two shapes
geoshapes(list(a = mbord[[1]], b = mbord[[1]]))
#> A 'geoshapes' object containing 2 shapes:
#> [1] "a" "b"
# Simulate the creation of a geoshapes object with two shapes
geoshapes(list(a = mbord[[1]], b = mbord[[1]]))
#> A 'geoshapes' object containing 2 shapes:
#> [1] "a" "b"