
Transform an lm or glm model that has only two variables into a function (useful for plotting, see examples).
# S3 method for class 'lm'
as.function(x, ...)Value
A function with argument x that returns the values predicted by the
model for these values of x.
Examples
data("trees", package = "datasets")
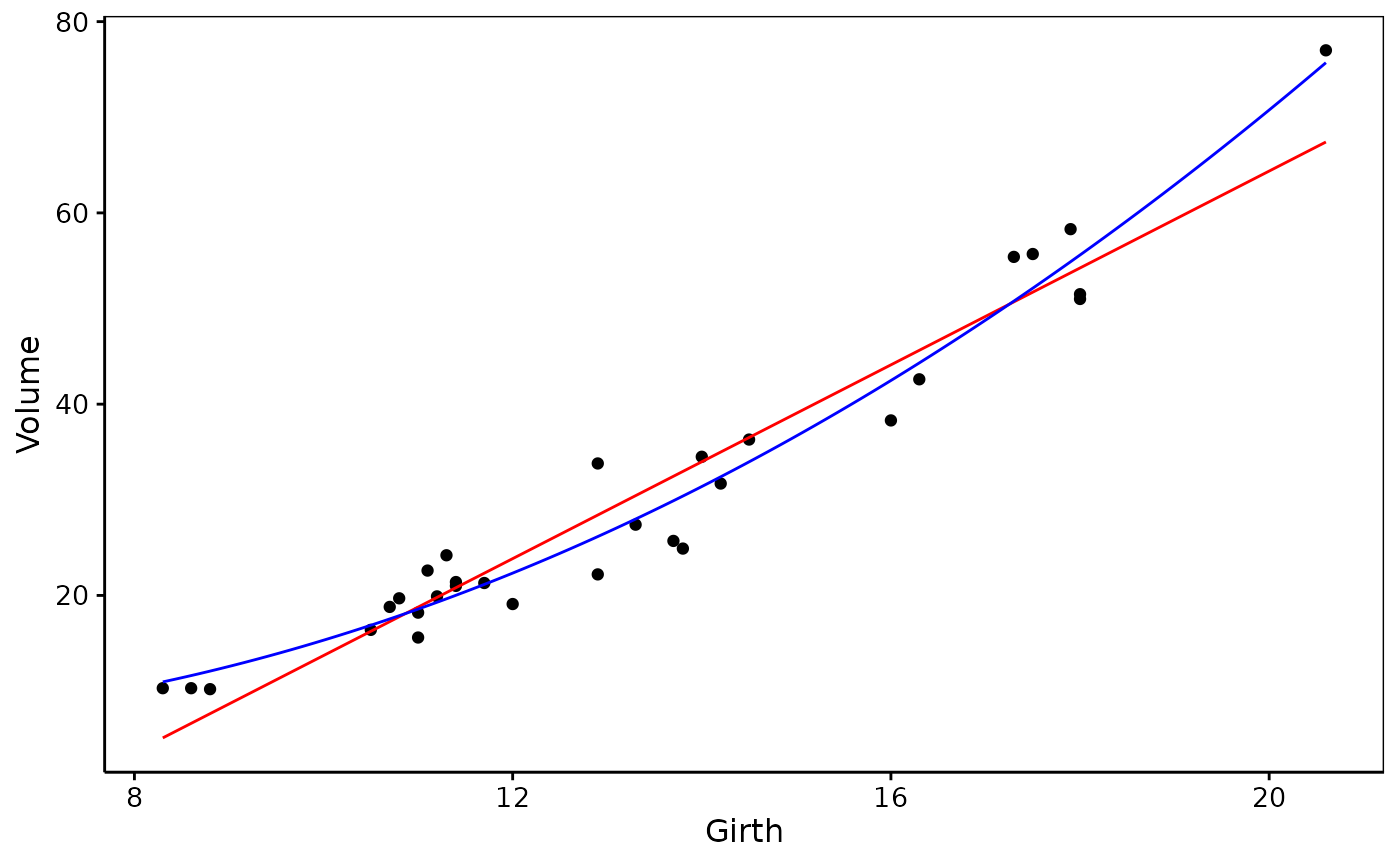
trees_lm1 <- lm(Volume ~ Girth, data = trees)
trees_lm2 <- lm(Volume ~ Girth + I(Girth^2), data = trees)
# Compare these two models on a chart
library(chart)
#> Loading required package: ggplot2
#> Loading required package: lattice
chart(trees, Volume ~ Girth) +
geom_point() +
stat_function(fun = as.function(trees_lm1), col = "red") +
stat_function(fun = as.function(trees_lm2), col = "blue")
 # The created function can also be used for easy predictions
trees_fn1 <- as.function(trees_lm1)
trees_fn1(10:20) # Volume for Girth 10:20
#> 1 2 3 4 5 6 7 8
#> 13.71511 18.78096 23.84682 28.91267 33.97853 39.04439 44.11024 49.17610
#> 9 10 11
#> 54.24196 59.30781 64.37367
# The created function can also be used for easy predictions
trees_fn1 <- as.function(trees_lm1)
trees_fn1(10:20) # Volume for Girth 10:20
#> 1 2 3 4 5 6 7 8
#> 13.71511 18.78096 23.84682 28.91267 33.97853 39.04439 44.11024 49.17610
#> 9 10 11
#> 54.24196 59.30781 64.37367