The methods autoplot() or chart() for lm or glm
objects. If type = model (by default for chart()), a scatterplot with the
model superimposed is produced, providing the model has only two numeric
variables (or a combination of these). The other types allow to analyze the
residuals of the model.
# S3 method for class 'lm'
chart(
  data,
  type = "model",
  ...,
  origdata = NULL,
  title,
  labels = "AUTO",
  name = deparse(substitute(data)),
  lang = getOption("SciViews_lang", "en"),
  env = parent.frame()
)

autoplot.lm(
  object,
  origdata = NULL,
  type = c("model", "resfitted", "qqplot", "scalelocation", "cooksd", "resleverage",
    "cookleverage", "reshist", "resautocor"),
  title,
  xlab,
  ylab,
  ...,
  name = deparse(substitute(object)),
  lang = getOption("SciViews_lang", "en"),
  env = parent.frame()
)
Arguments
- data
A lm or glm model.
- type
The type of plot:
"model","resfitted","qqplot","scalelocation","cooksd","resleverage","cookleverage","reshist"or"resautocor". Forchart(), can also be provided aschart$type(....).chart()also uses"residuals"that constructs a combined figure with resfitted, qqplot, scalelocation and resleverage.- ...
Additional arguments passed to the chart.“
- origdata
The original dataset this model was fitted to. Only required for
type = modeland in case untransformed X variable is not in the model.- title
A title for the plot. If not provided, a default title is computed.
- labels
A vector of four character strings, one for each plot done with
chart$residuals().- name
The name of the model. If not provided, it is the name of the model object by default.
- lang
The language to use for titles and labels, currently only
"en"or"fr".`- env
The environment to evaluate code. It is
parent.frame()by default, and there is no reasons to change it, unless you really know what you are doing!- object
Idem
- xlab
A label for the X axis. A default label is proposed if it is not provided.
- ylab
A label for the Y axis (with default if not provided).
Value
The ggplot object produced.
Examples
library(chart)
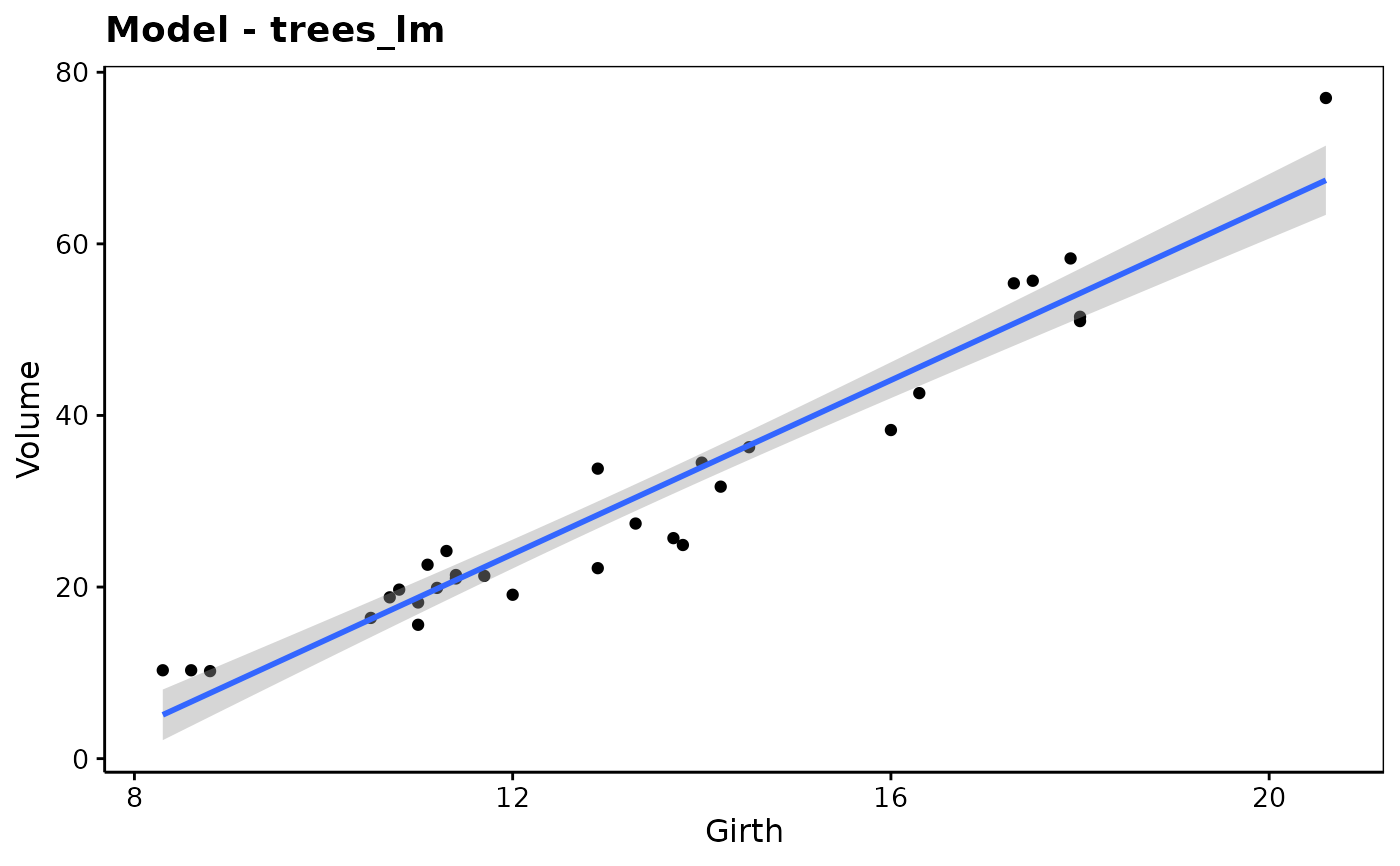
data(trees, package = "datasets")
trees_lm <- lm(Volume ~ Girth, data = trees)
chart(trees_lm) # origdata not needed because untransformed variables
#> Warning: `aes_string()` was deprecated in ggplot2 3.0.0.
#> ℹ Please use tidy evaluation idioms with `aes()`.
#> ℹ See also `vignette("ggplot2-in-packages")` for more information.
#> ℹ The deprecated feature was likely used in the modelit package.
#> Please report the issue at <https://github.com/SciViews/modelit/issues>.
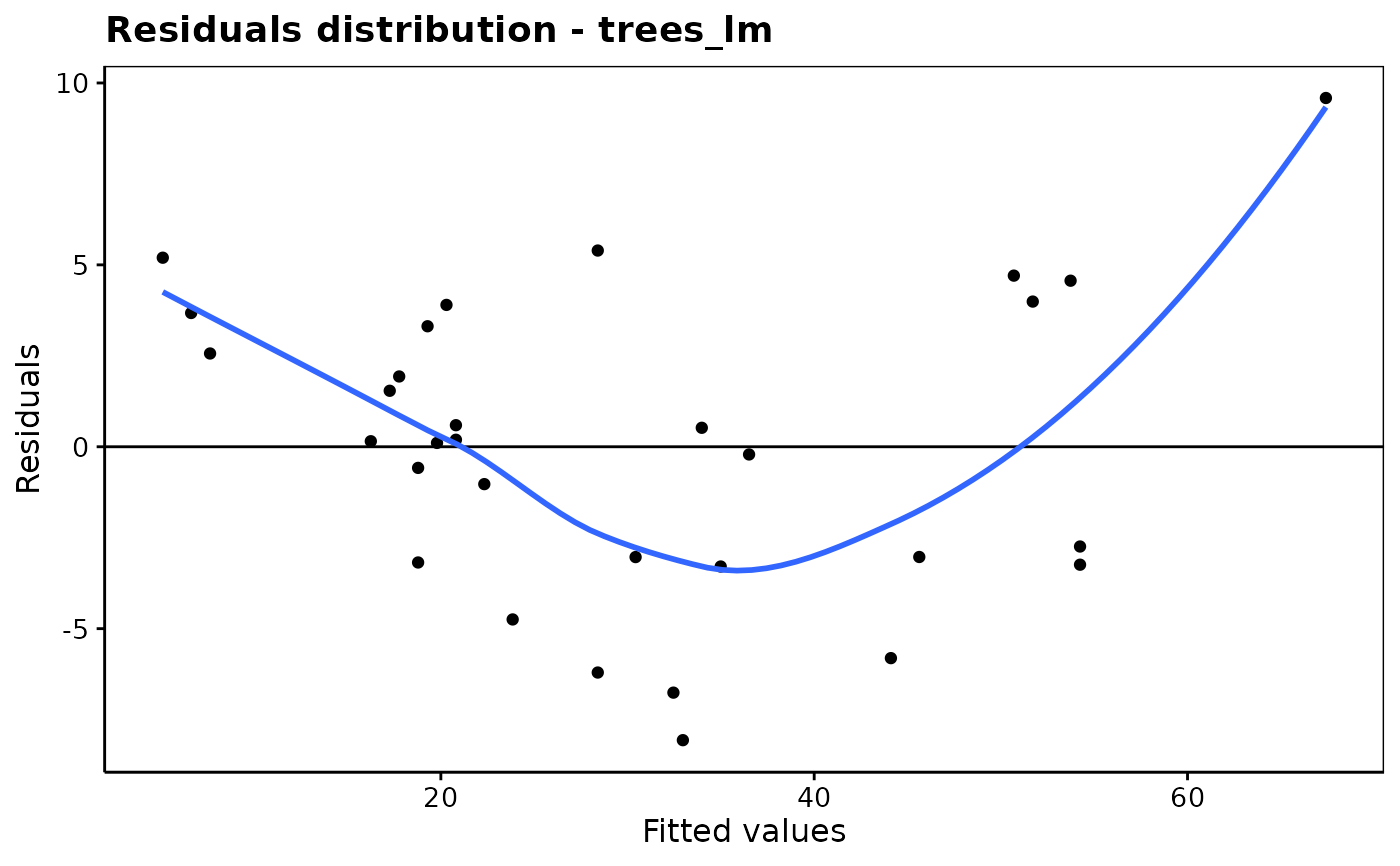
 # Residuals analysis
chart$resfitted(trees_lm)
# Residuals analysis
chart$resfitted(trees_lm)
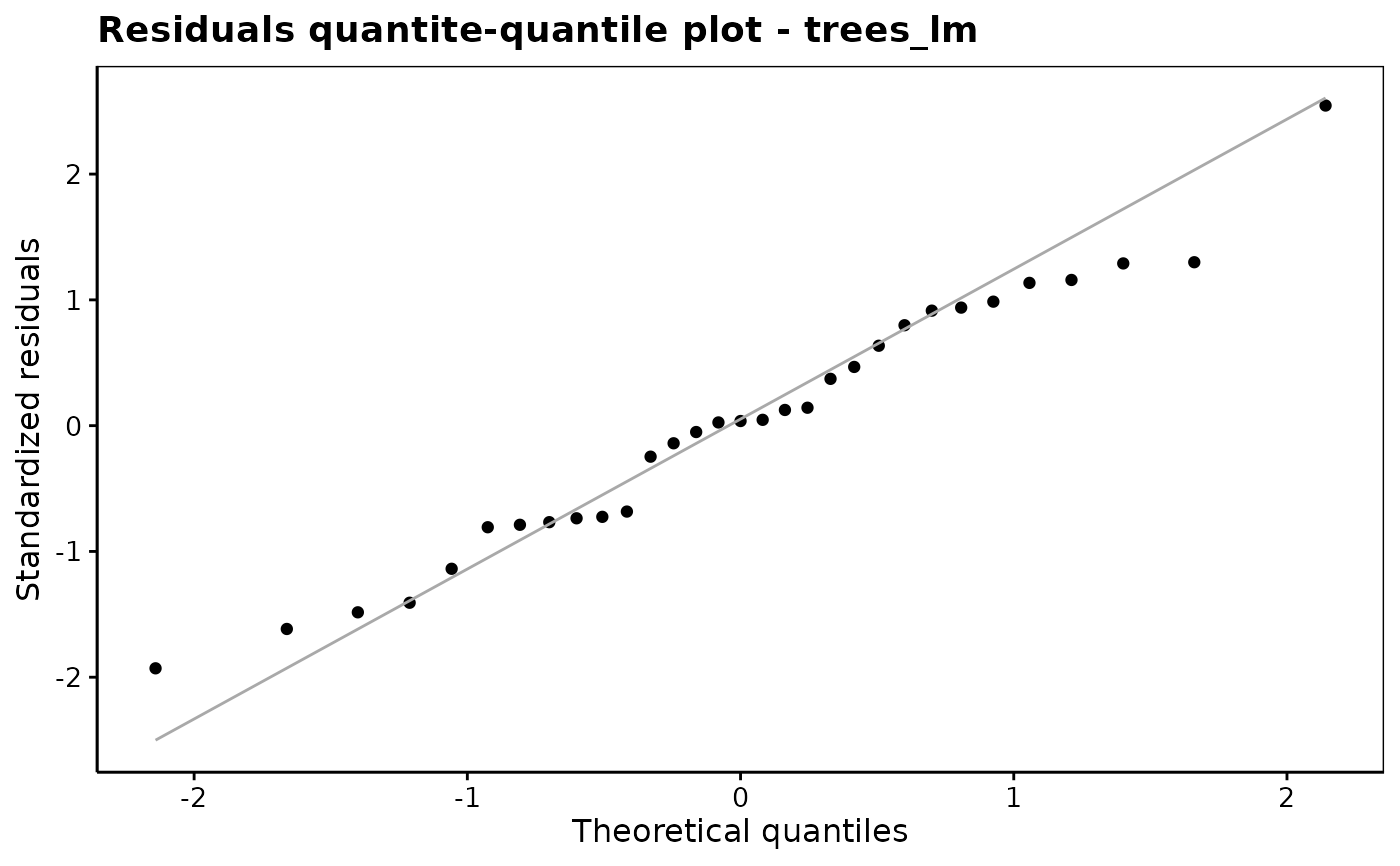
 chart$qqplot(trees_lm)
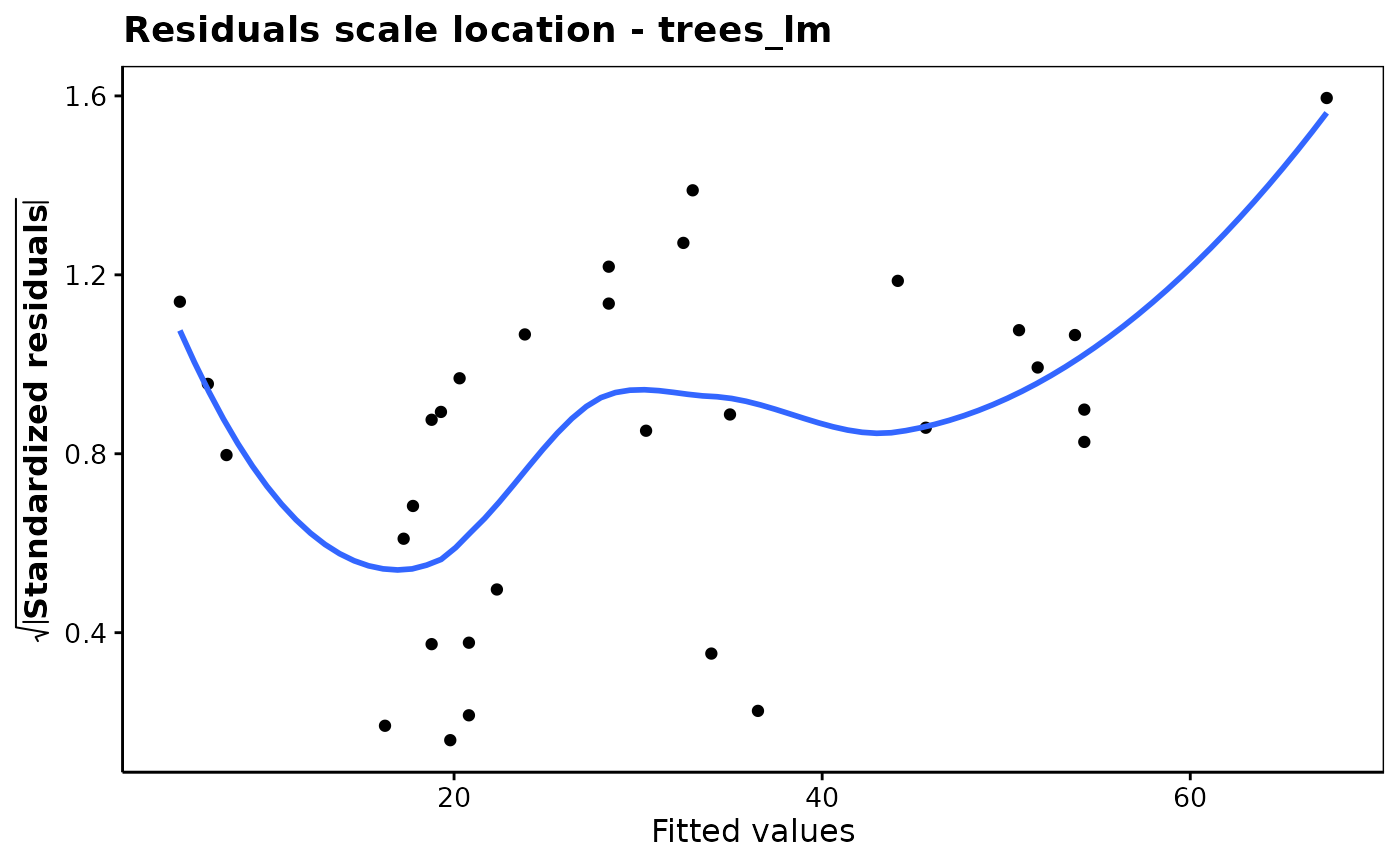
 chart$scalelocation(trees_lm)
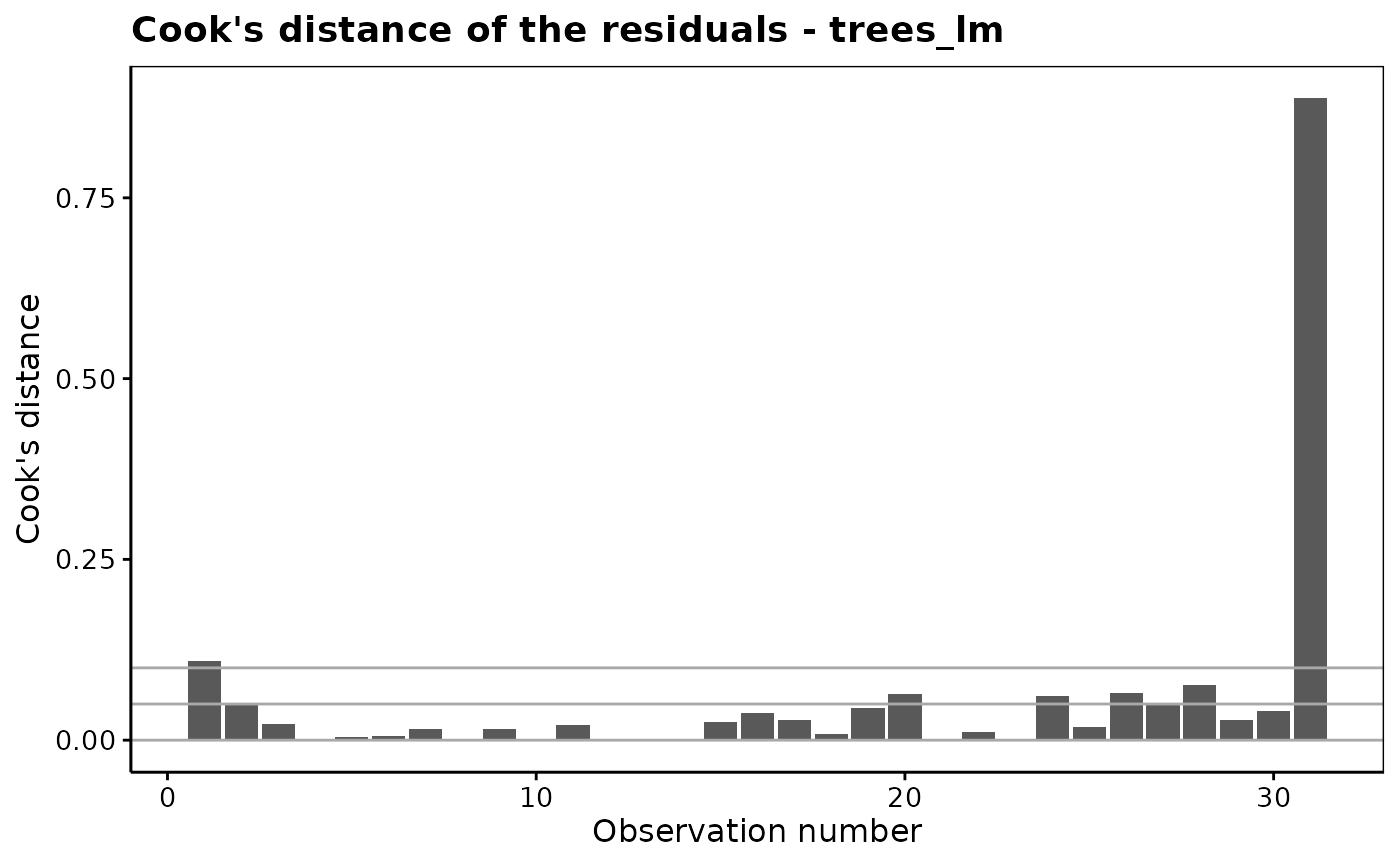
 chart$cooksd(trees_lm)
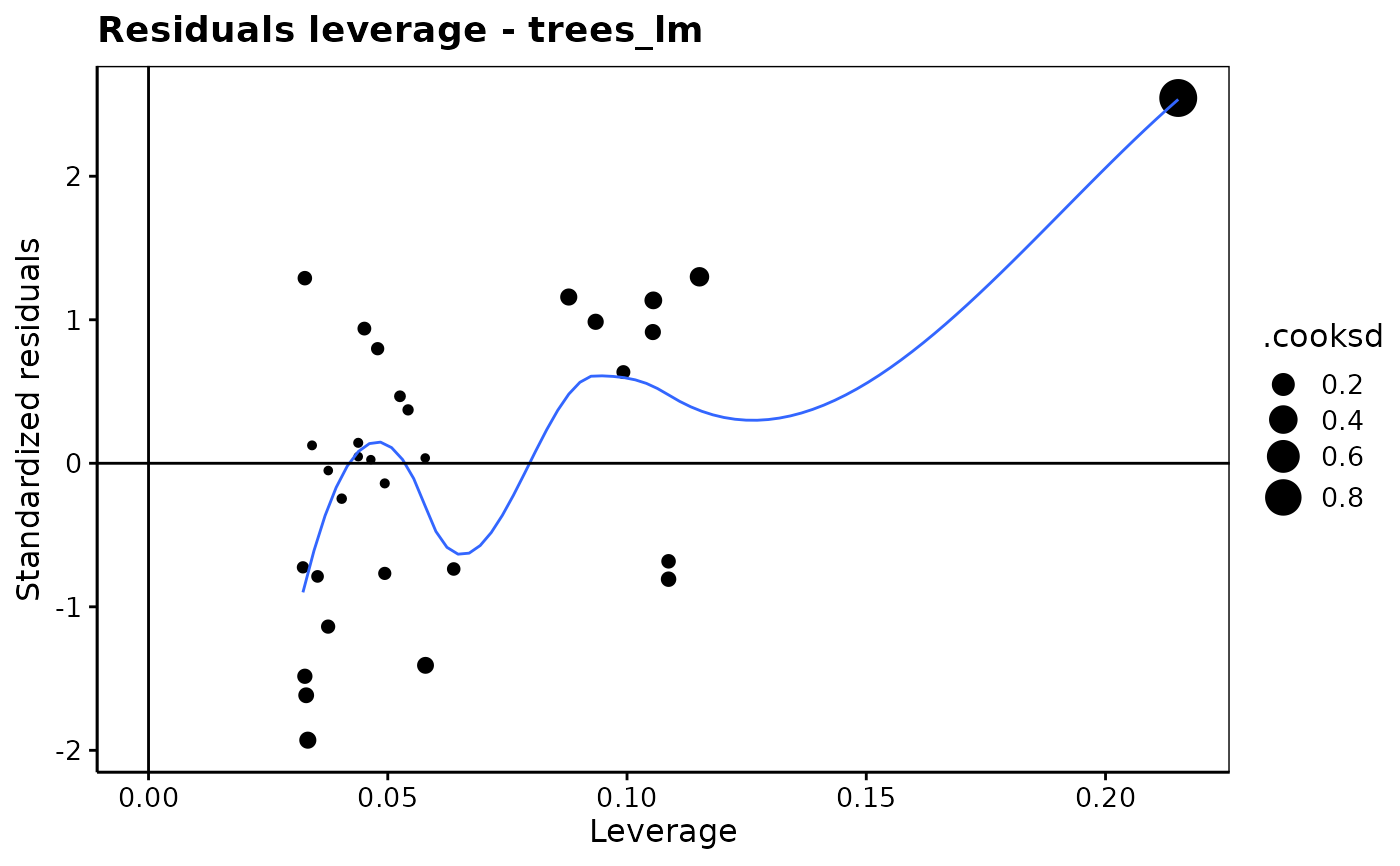
 chart$resleverage(trees_lm)
#> Warning: Using `size` aesthetic for lines was deprecated in ggplot2 3.4.0.
#> ℹ Please use `linewidth` instead.
#> ℹ The deprecated feature was likely used in the modelit package.
#> Please report the issue at <https://github.com/SciViews/modelit/issues>.
chart$resleverage(trees_lm)
#> Warning: Using `size` aesthetic for lines was deprecated in ggplot2 3.4.0.
#> ℹ Please use `linewidth` instead.
#> ℹ The deprecated feature was likely used in the modelit package.
#> Please report the issue at <https://github.com/SciViews/modelit/issues>.
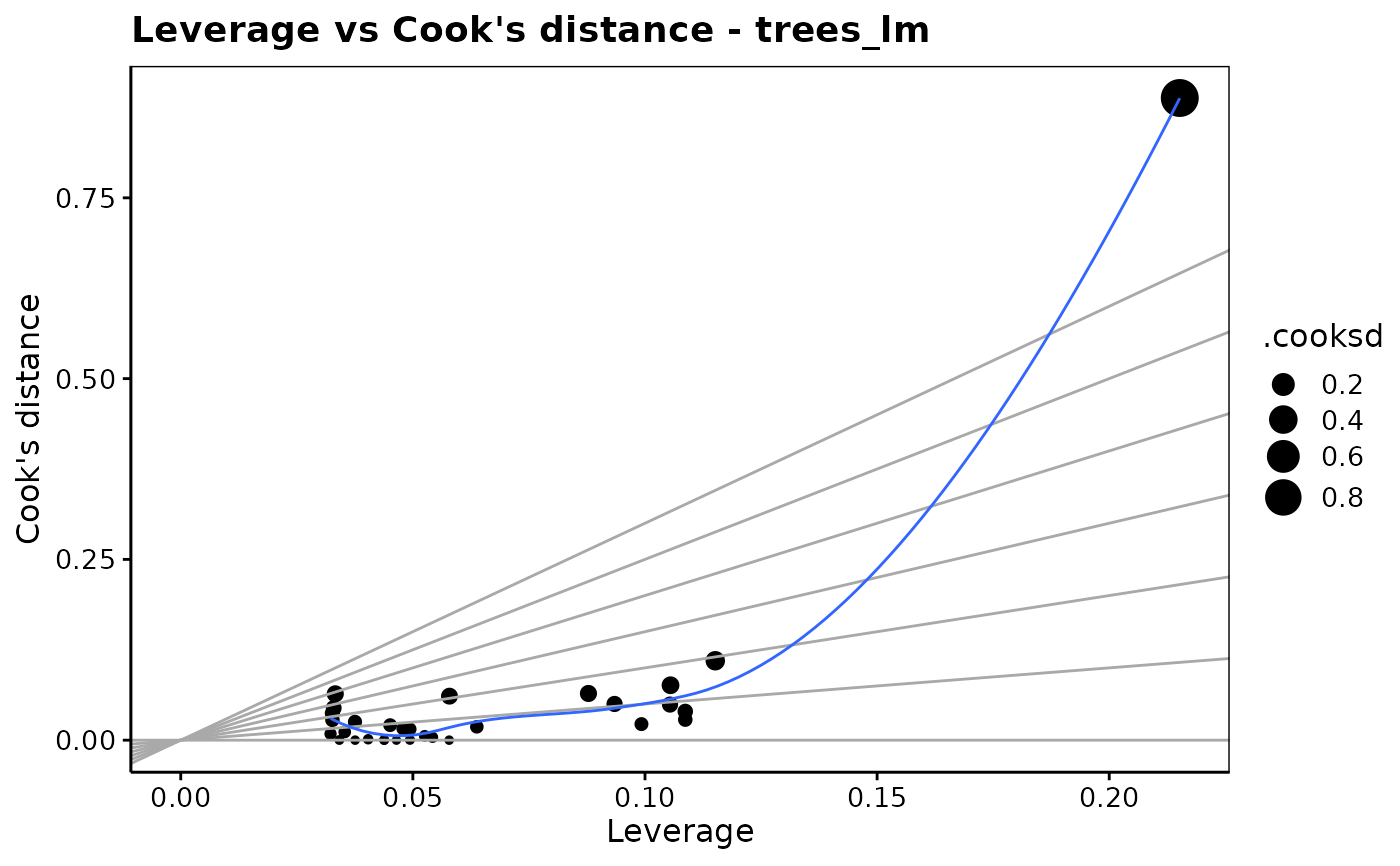
 chart$cookleverage(trees_lm)
 chart$reshist(trees_lm, bins = 15)
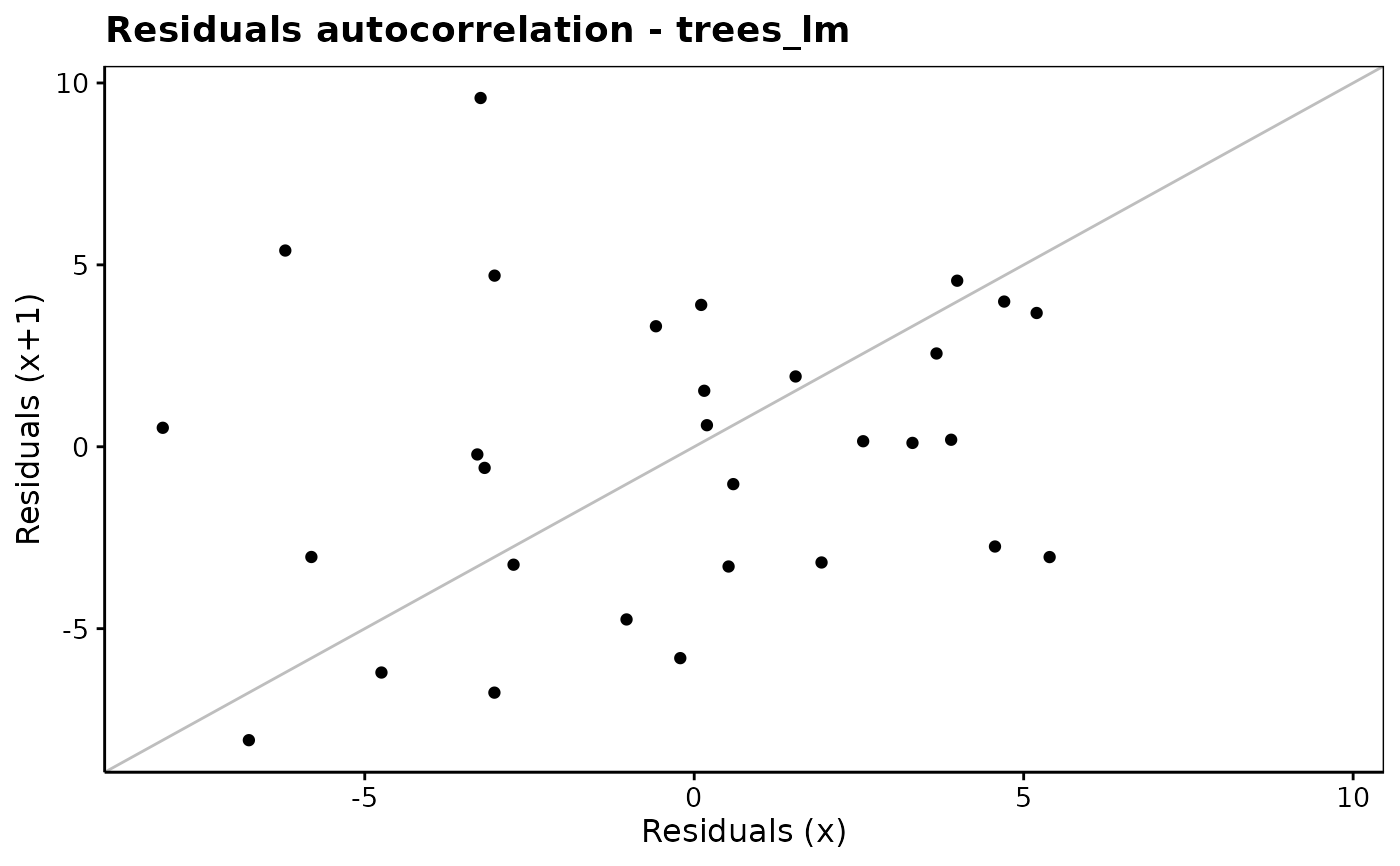
 chart$resautocor(trees_lm)
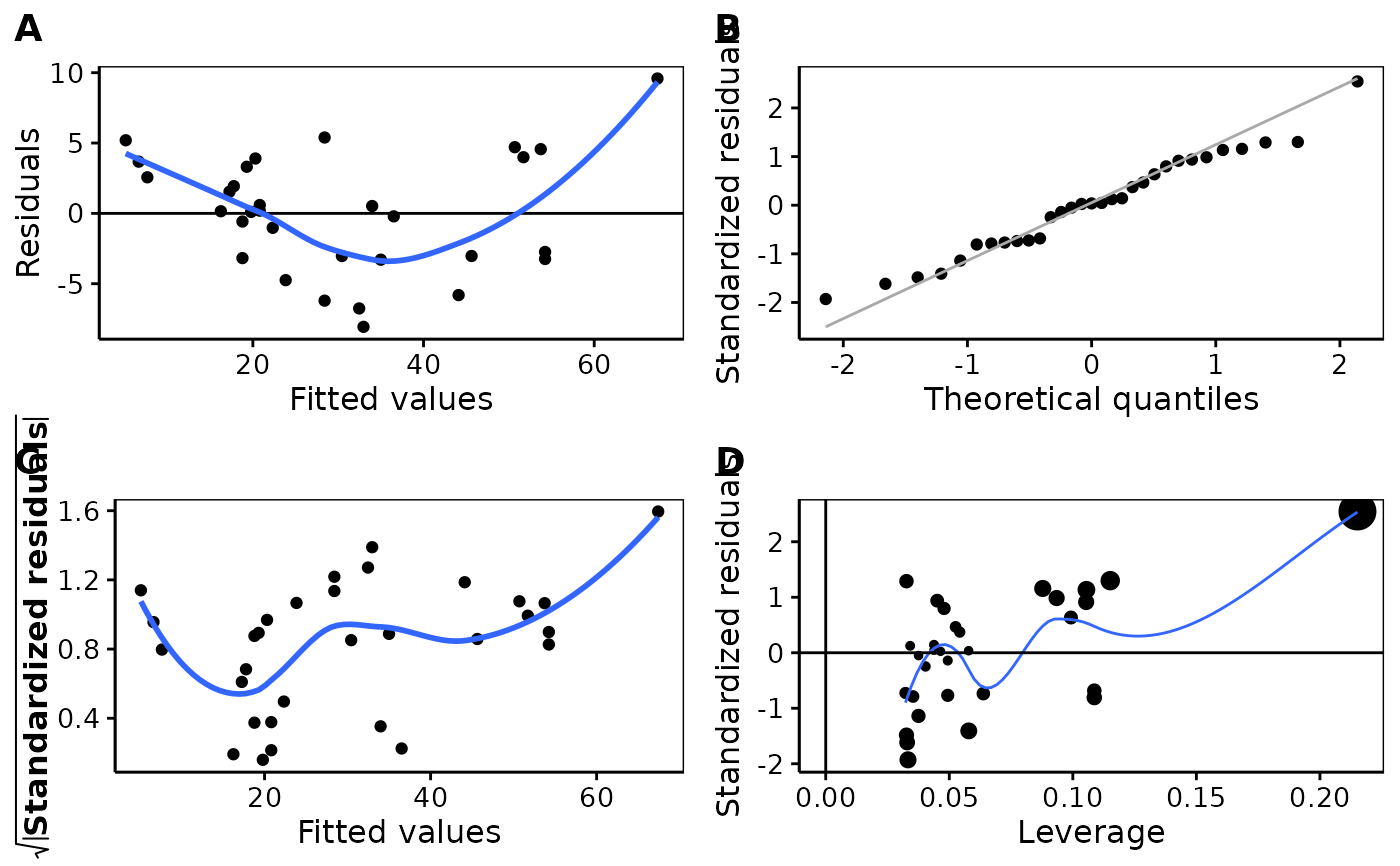
 # The four most important residual analysis plots in one figure
chart$residuals(trees_lm)
# The four most important residual analysis plots in one figure
chart$residuals(trees_lm)
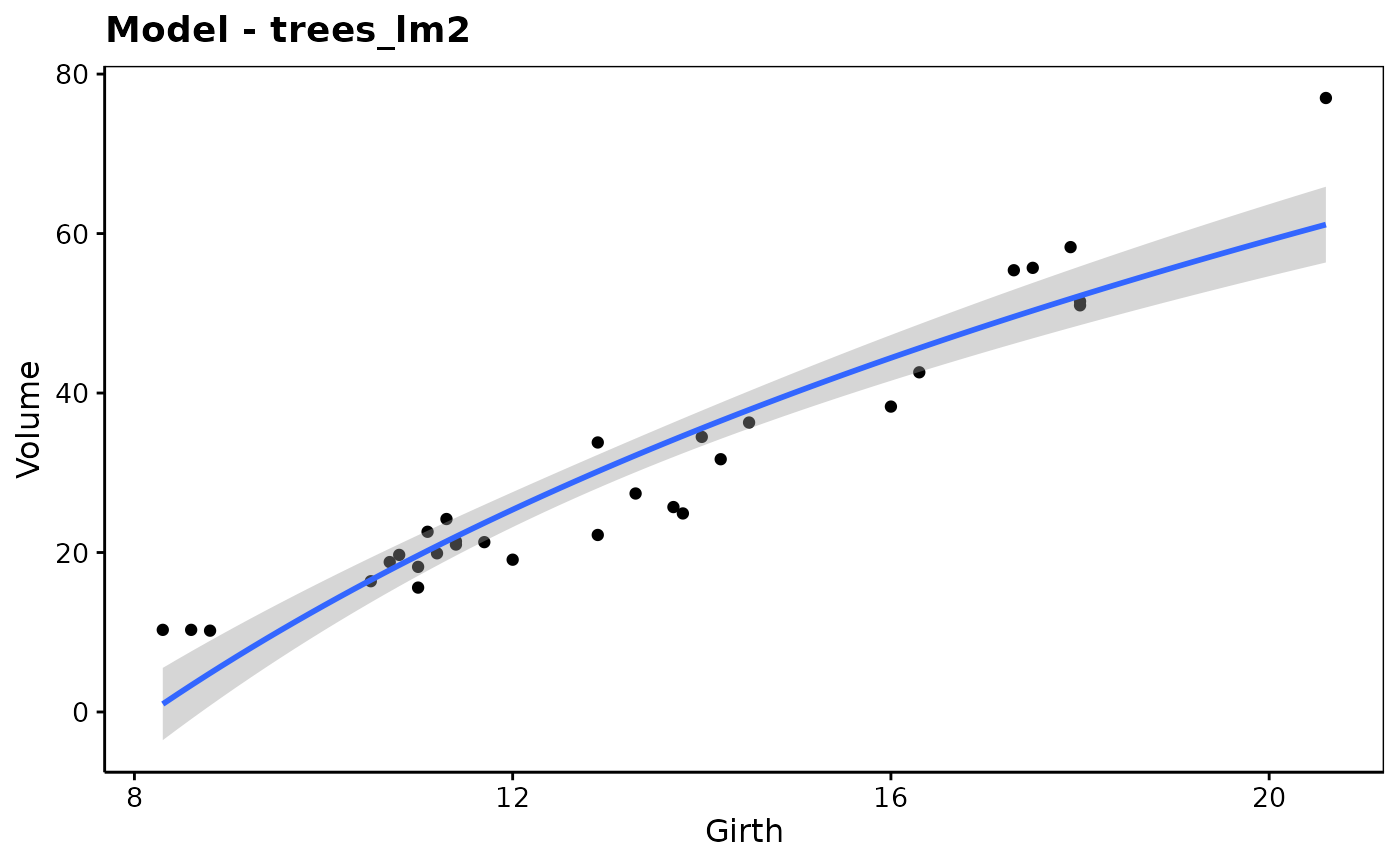
 trees_lm2 <- lm(Volume ~ log(Girth), data = trees)
chart(trees_lm2, origdata = trees) # origdata needed, cf. transformed Girth
trees_lm2 <- lm(Volume ~ log(Girth), data = trees)
chart(trees_lm2, origdata = trees) # origdata needed, cf. transformed Girth
 trees_lm3 <- lm(Volume ~ Girth + Height, data = trees)
# chart(trees_lm3) # Error because more than 2 variables!
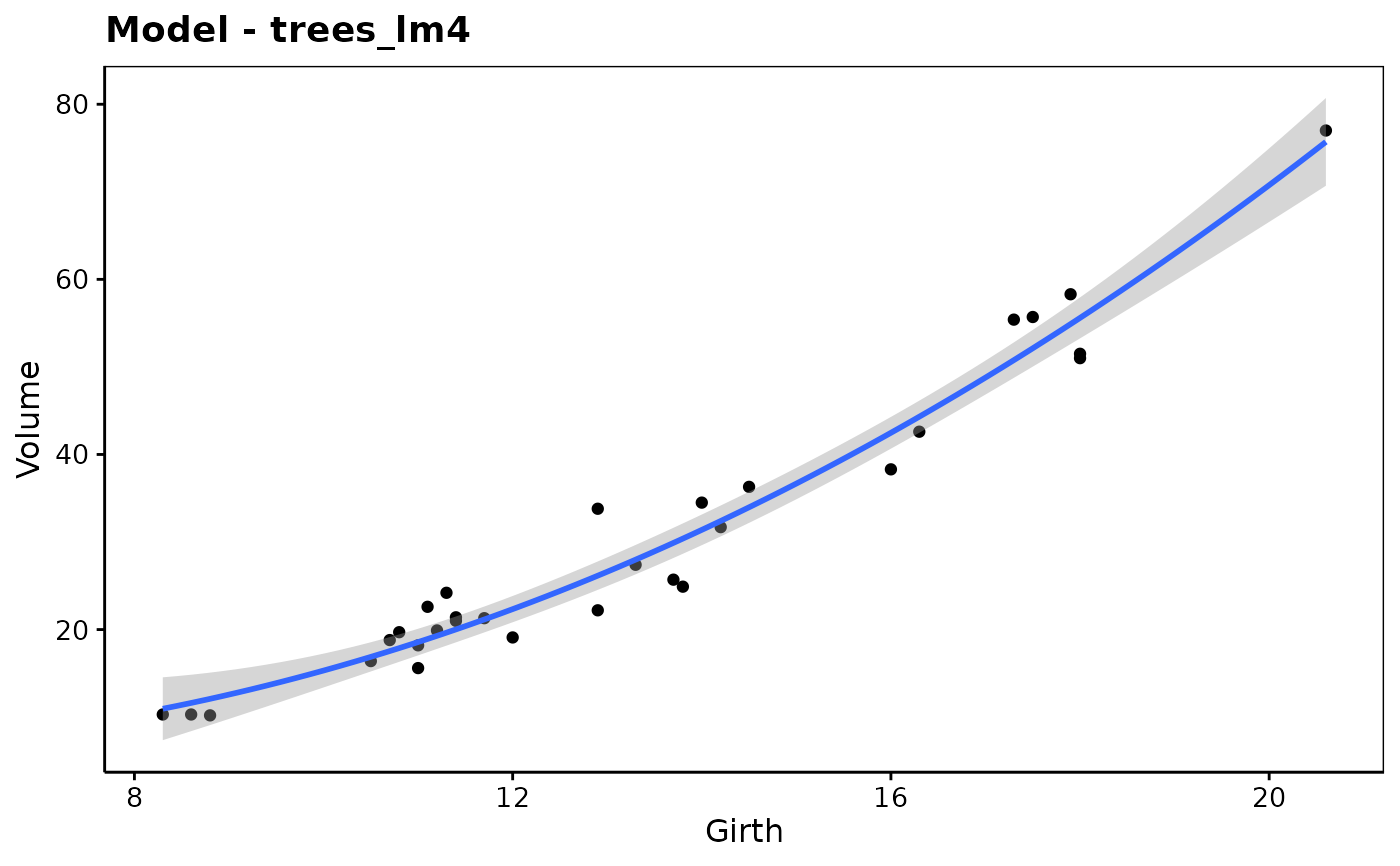
# Polynomial regressions work too
trees_lm4 <- lm(Volume ~ I(Girth^2) + Girth, data = trees)
chart(trees_lm4)
trees_lm3 <- lm(Volume ~ Girth + Height, data = trees)
# chart(trees_lm3) # Error because more than 2 variables!
# Polynomial regressions work too
trees_lm4 <- lm(Volume ~ I(Girth^2) + Girth, data = trees)
chart(trees_lm4)
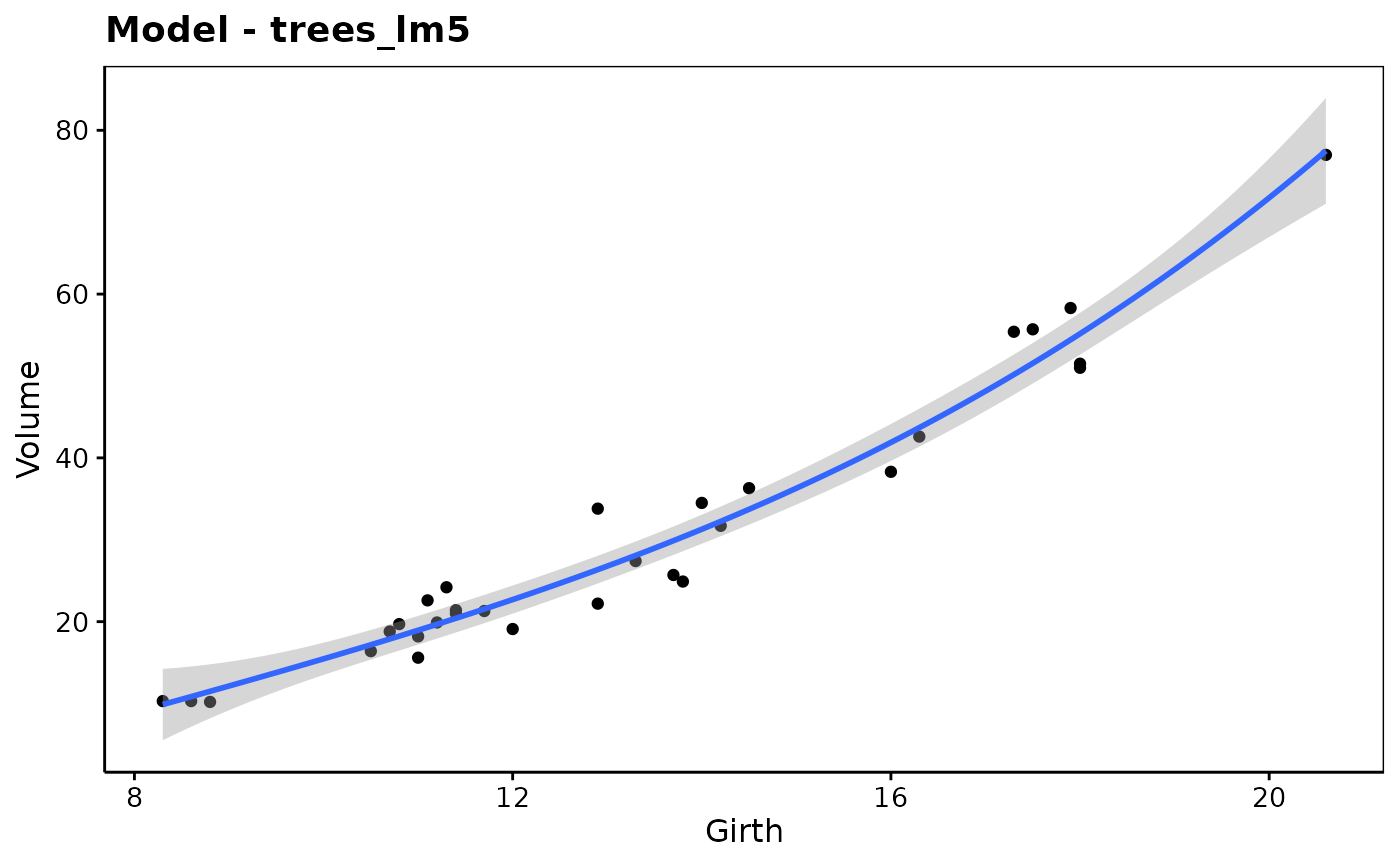
 # or using poly()
trees_lm5 <- lm(Volume ~ poly(Girth, 3), data = trees)
chart(trees_lm5, origdata = trees) # origdata required here!
# or using poly()
trees_lm5 <- lm(Volume ~ poly(Girth, 3), data = trees)
chart(trees_lm5, origdata = trees) # origdata required here!