add_predictions() and add_residuals() are pipe-friendly
functions to add predictions or residuals to a data frame.
geom_ref_line() adds a vertical of horizontal reference line. rmse()
(the root-mean-squared-error), [mae[]] (the mean absolute error), qae()
(the quantiles of absolute error) and rsquare() (the variance of the
predictions divided by the variance of the response) are useful model
metrics.
add_predictions(data, model, var = "pred", type = NULL)

add_residuals(data, model, var = "resid")

geom_ref_line(h, v, color = "red", colour = color, size = 1)

rmse(model, data)

mae(model, data)

qae(model, data, probs = c(0.05, 0.25, 0.5, 0.75, 0.95))

rsquare(model, data)
Arguments
- data
A data frame
- model
A model that has a
predict()method.- var
A string with the name of the predictions or residuals variable (by default, it is
"pred"and"resid"respectively)- type
If the model's
predict()method has atype=argument, you can give it here.- h
Position of the horizontal reference line
- v
Position of the vertical reference line
- color
The color of the reference line
- colour
Same as above (use the one you prefer)
- size
The width of the reference line
- probs
A numeric vector of probabilities
Value
A function with argument x that returns the values predicted by the
model for these values of x.
Examples
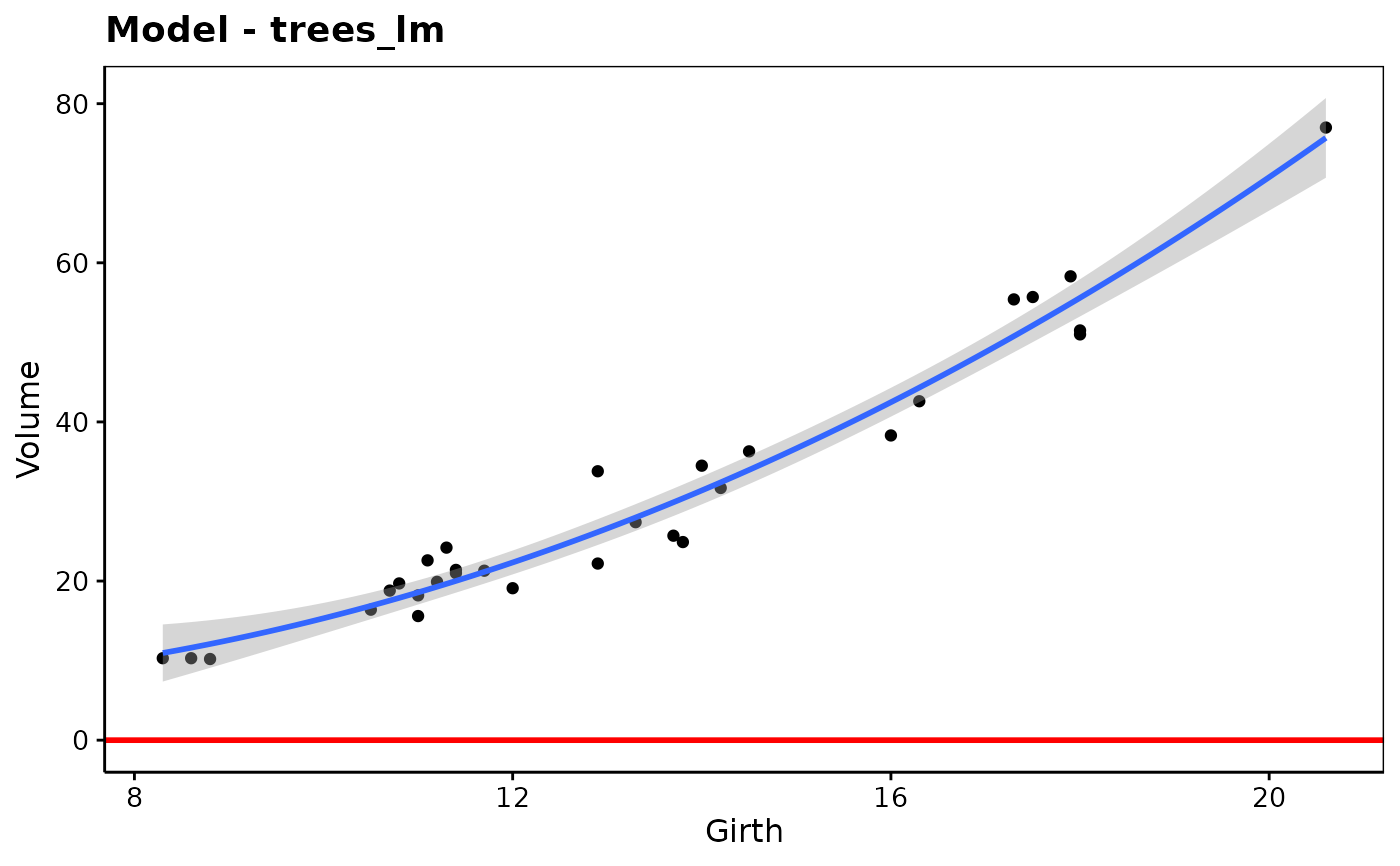
data(trees, package = "datasets")
trees_lm <- lm(Volume ~ Girth + I(Girth^2), data = trees)
rmse(trees_lm, trees)
#> [1] 3.169319
rsquare(trees_lm, trees)
#> [1] 0.9615866
mae(trees_lm, trees)
#> [1] 2.608712
qae(trees_lm, trees, probs = c(0, 0.25, 0.5, 0.75, 1)) # Resids five numbers
#>        0%       25%       50%       75%      100%
#> 0.1481196 1.1210224 2.3332344 4.0265937 7.6447381

add_predictions(trees, trees_lm)
#>    Girth Height Volume     pred
#> 1    8.3     70   10.3 10.95660
#> 2    8.6     65   10.3 11.61946
#> 3    8.8     63   10.2 12.08683
#> 4   10.5     72   16.4 16.88157
#> 5   10.7     81   18.8 17.54238
#> 6   10.8     83   19.7 17.88042
#> 7   11.0     66   15.6 18.57178
#> 8   11.0     75   18.2 18.57178
#> 9   11.1     80   22.6 18.92509
#> 10  11.2     75   19.9 19.28349
#> 11  11.3     79   24.2 19.64699
#> 12  11.4     76   21.0 20.01558
#> 13  11.4     76   21.4 20.01558
#> 14  11.7     69   21.3 21.15188
#> 15  12.0     75   19.1 22.33400
#> 16  12.9     74   22.2 26.15526
#> 17  12.9     85   33.8 26.15526
#> 18  13.3     86   27.4 27.98596
#> 19  13.7     71   25.7 29.89811
#> 20  13.8     64   24.9 30.38887
#> 21  14.0     78   34.5 31.38568
#> 22  14.2     80   31.7 32.40284
#> 23  14.5     74   36.3 33.96677
#> 24  16.0     72   38.3 42.47365
#> 25  16.3     77   42.6 44.31248
#> 26  17.3     81   55.4 50.77280
#> 27  17.5     82   55.7 52.12595
#> 28  17.9     80   58.3 54.89335
#> 29  18.0     80   51.5 55.59793
#> 30  18.0     80   51.0 55.59793
#> 31  20.6     87   77.0 75.70375
add_residuals(trees, trees_lm)
#>    Girth Height Volume      resid
#> 1    8.3     70   10.3 -0.6566002
#> 2    8.6     65   10.3 -1.3194638
#> 3    8.8     63   10.2 -1.8868266
#> 4   10.5     72   16.4 -0.4815670
#> 5   10.7     81   18.8  1.2576216
#> 6   10.8     83   19.7  1.8195798
#> 7   11.0     66   15.6 -2.9717761
#> 8   11.0     75   18.2 -0.3717761
#> 9   11.1     80   22.6  3.6749098
#> 10  11.2     75   19.9  0.6165050
#> 11  11.3     79   24.2  4.5530094
#> 12  11.4     76   21.0  0.9844231
#> 13  11.4     76   21.4  1.3844231
#> 14  11.7     69   21.3  0.1481196
#> 15  12.0     75   19.1 -3.2340006
#> 16  12.9     74   22.2 -3.9552619
#> 17  12.9     85   33.8  7.6447381
#> 18  13.3     86   27.4 -0.5859598
#> 19  13.7     71   25.7 -4.1981097
#> 20  13.8     64   24.9 -5.4888741
#> 21  14.0     78   34.5  3.1143250
#> 22  14.2     80   31.7 -0.7028390
#> 23  14.5     74   36.3  2.3332344
#> 24  16.0     72   38.3 -4.1736500
#> 25  16.3     77   42.6 -1.7124772
#> 26  17.3     81   55.4  4.6272001
#> 27  17.5     82   55.7  3.5740465
#> 28  17.9     80   58.3  3.4066504
#> 29  18.0     80   51.5 -4.0979255
#> 30  18.0     80   51.0 -4.5979255
#> 31  20.6     87   77.0  1.2962470

library(chart)
chart(trees_lm) +
  geom_ref_line(h = 0) # Not particularly useful here, just an example