
Test if an increasing or decreasing trend exists in a time series
trend.test.RdTest if the series has an increasing or decreasing trend, using a non-parametric Spearman test between the observations and time
trend.test(tseries, R=1)Arguments
Value
A 'htest' object if R=1, a 'boot' object with an added boot$p.value item otherwise
References
Siegel, S. & N.J. Castellan, 1988. Non-parametric statistics. McGraw-Hill, New York. 399 pp.
Note
In both cases (normal test with R=1 and bootstrap test), the p-value can be obtained from obj$p.value (see examples)
See also
Examples
data(marbio)
trend.test(marbio[, 8])
#> Warning: Cannot compute exact p-value with ties
#>
#> Spearman's rank correlation rho
#>
#> data: marbio[, 8] and time(marbio[, 8])
#> S = 43853, p-value = 0.1841
#> alternative hypothesis: true rho is not equal to 0
#> sample estimates:
#> rho
#> 0.1630113
#>
# Run a bootstrap test on the same series
marbio8.trend.test <- trend.test(marbio[, 8], R=99)
# R=999 is a better value... but it is very slow!
marbio8.trend.test
#>
#> BLOCK BOOTSTRAP FOR TIME SERIES
#>
#> Fixed Block Length of 1
#>
#> Call:
#> tsboot(tseries = x, statistic = test.trend, R = R, l = 1, sim = "fixed")
#>
#>
#> Bootstrap Statistics :
#> original bias std. error
#> t1* 0.1630113 -0.140559 0.1213218
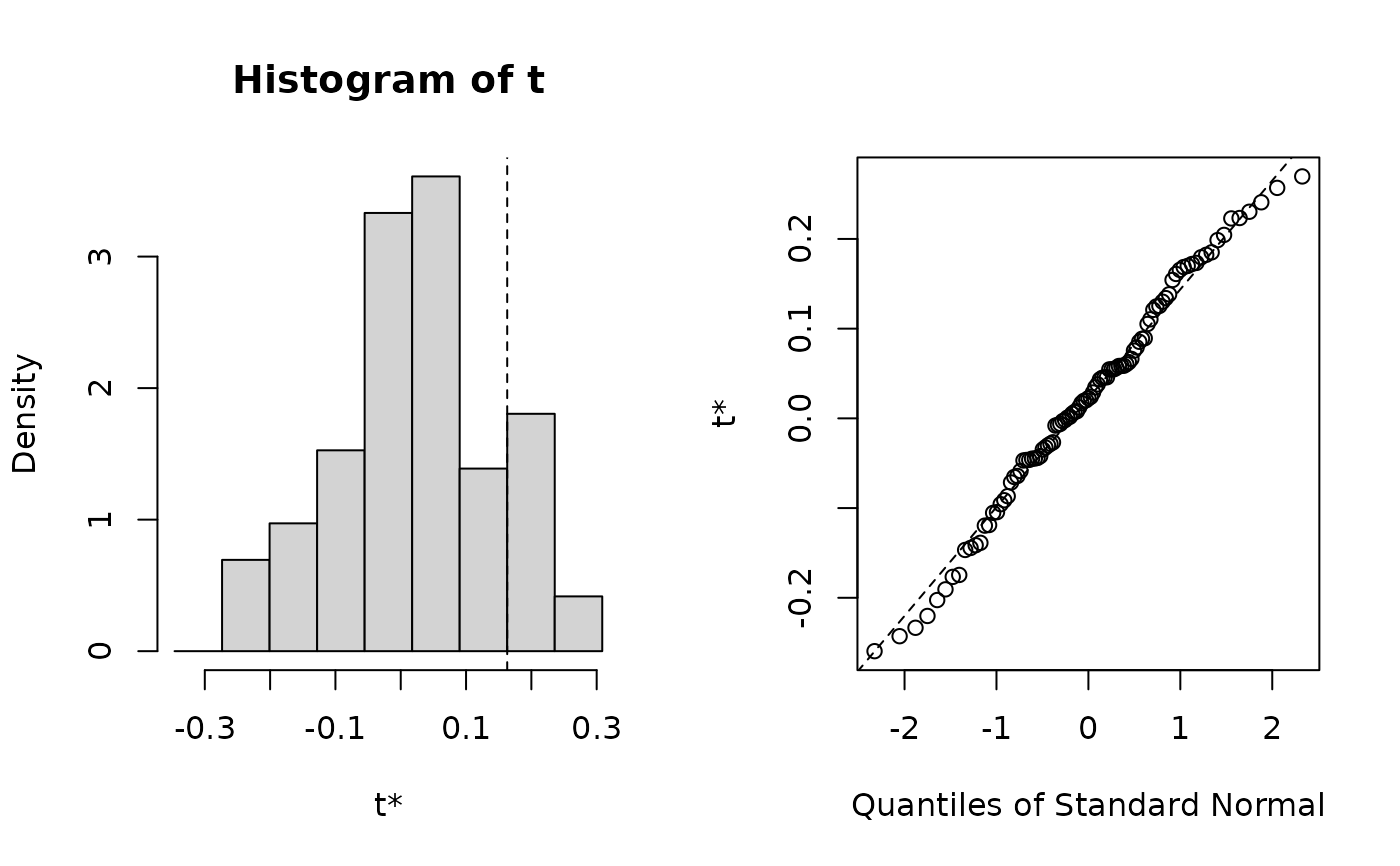
plot(marbio8.trend.test)
 marbio8.trend.test$p.value
#> [1] 0.2424242
marbio8.trend.test$p.value
#> [1] 0.2424242