In case a textual argument allows for selecting the result, for
instance, if plot() allows for several charts that you can choose with a
type= or which=, making the function 'subsettable' also allows to
indicate fun$variant(). The subsettable_type2 variant is faster for only
internal implementation of various types, while subsettable_type first
searches for a function with name.<generic>$type(). See examples.
# S3 method for class 'subsettable_type'
x$name

# S3 method for class 'subsettable_type2'
x$name

# S3 method for class 'subsettable_which'
x$name

name_function_type(fun, method = NULL, type)

list_types(fun, method = NULL)

get_type(fun, method = NULL, type, stop.if.missing = TRUE)

args_type(fun, method = NULL, type)

# S3 method for class 'subsettable_type'
.DollarNames(x, pattern = "")
Arguments
- x
A
subsettable_typefunction.- name
The value to use for the
type=argument.- fun
The name of the function (as a scalar string).
- method
An optional method name (as a scalar string).
- type
The type to select (as a scalar string).
- stop.if.missing
If
TRUE(default), an error is raised if the requested type is not found. IfFALSE,NULLis returned instead.- pattern
A regular expression. Only matching names are returned.
Examples
# Simple selection of type with a switch inside the function itself
foo <- structure(function(x, type = c("histogram", "boxplot"), ...) {
  type <- match.arg(type, c("histogram", "boxplot"))
  switch(type,
    histogram = hist(x, ...),
    boxplot = boxplot(x, ...),
    stop("unknow type")
  )
}, class = c("function", "subsettable_type2"))
foo
#> function (x, type = c("histogram", "boxplot"), ...)
#> {
#>     type <- match.arg(type, c("histogram", "boxplot"))
#>     switch(type, histogram = hist(x, ...), boxplot = boxplot(x,
#>         ...), stop("unknow type"))
#> }
#> <environment: 0x563ad7efa730>
#> attr(,"class")
#> [1] "function"          "subsettable_type2"

# This function can be used as usual:
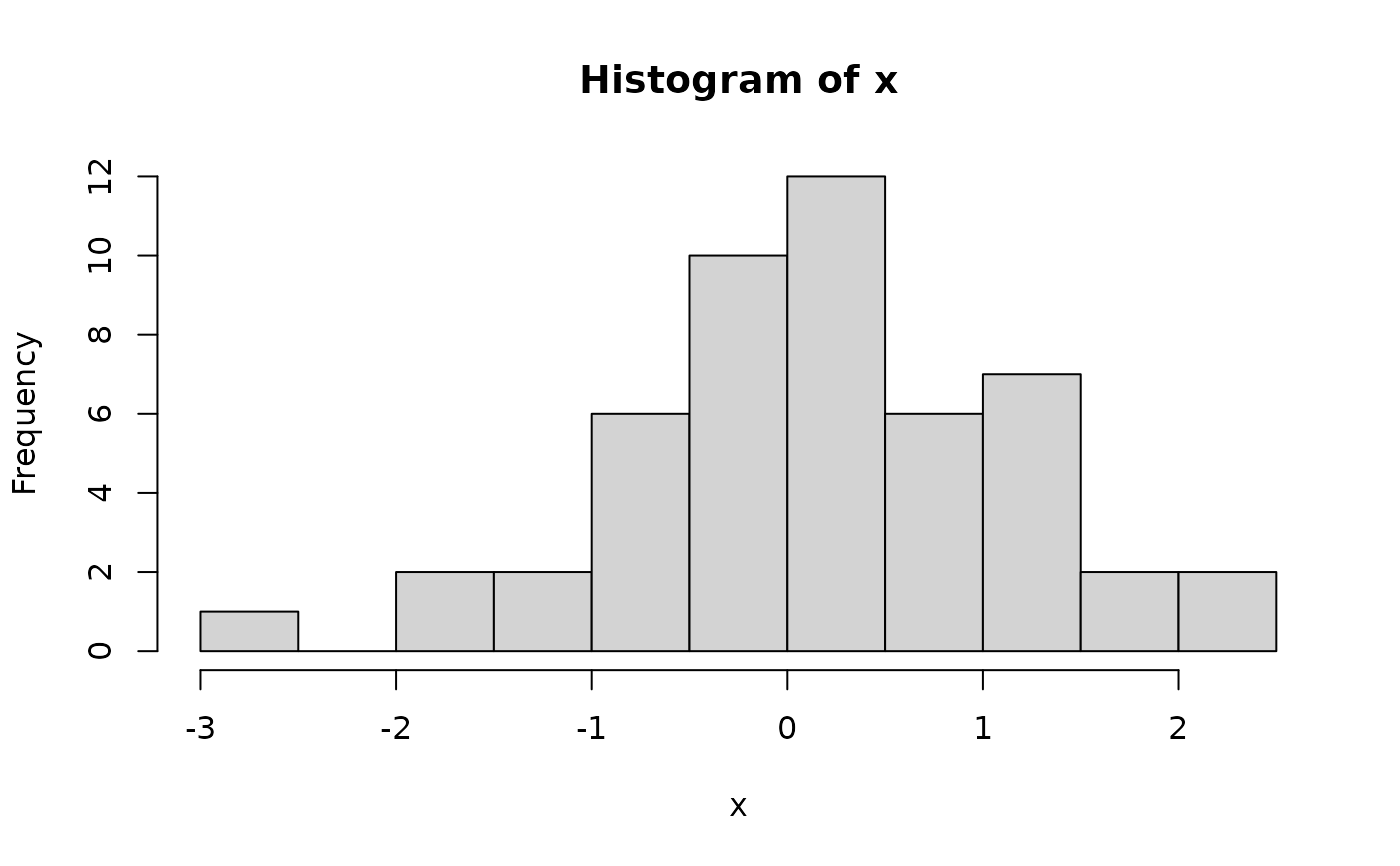
foo(rnorm(50), type = "histogram")

# ... but also this way:
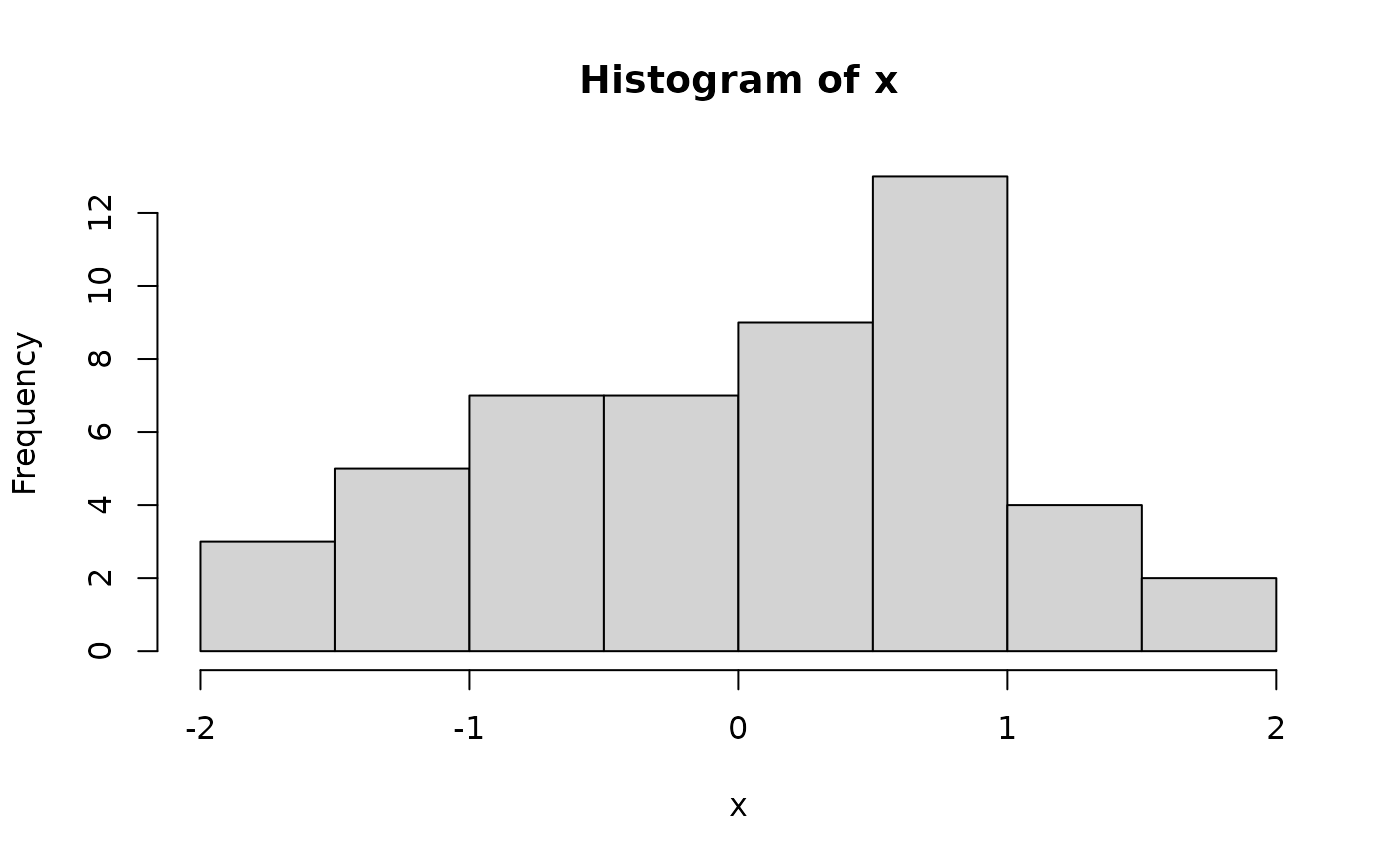
foo$histogram(rnorm(50))

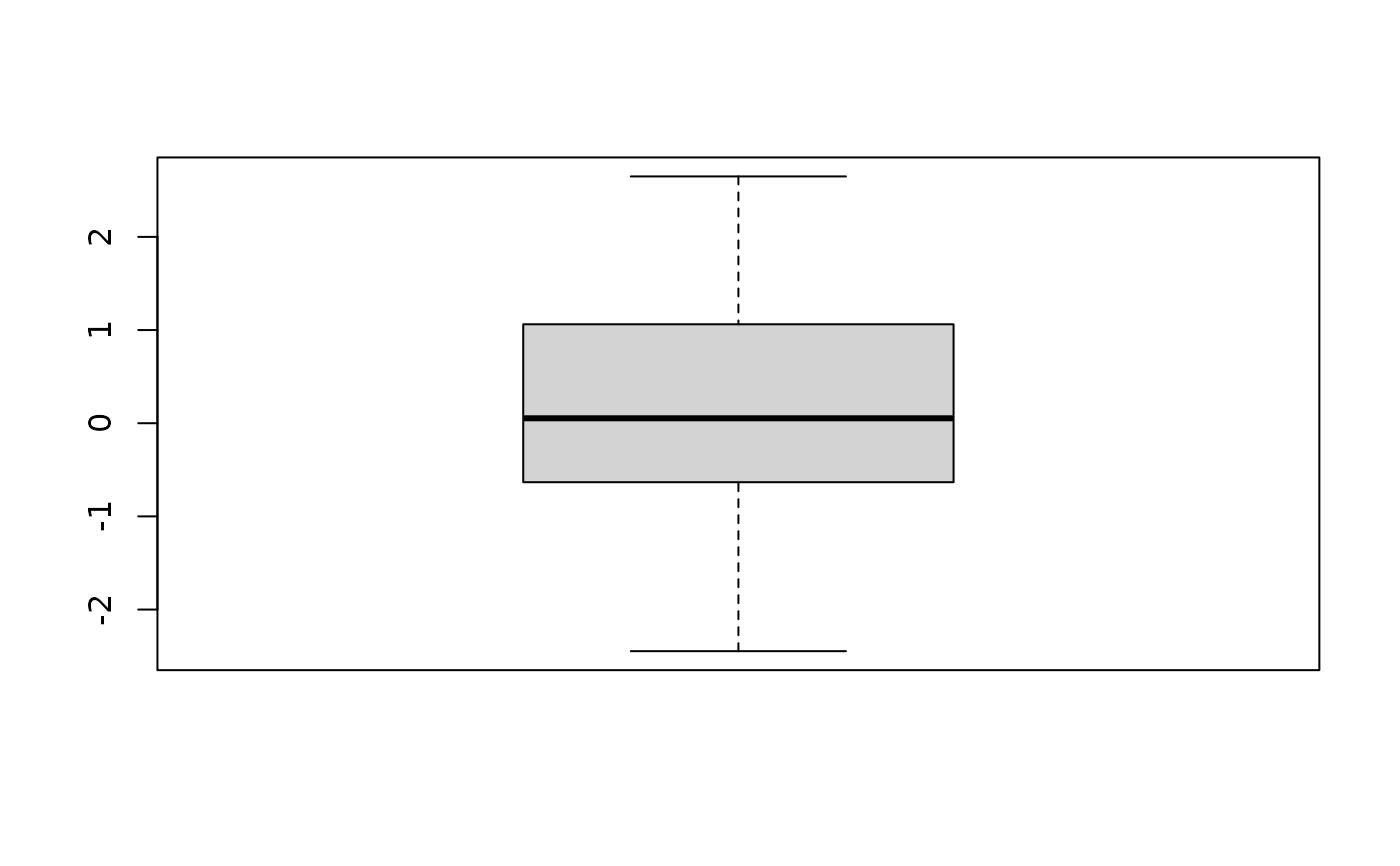
foo$boxplot(rnorm(50))


# A more complex use, where it is possible to define additional types easily.
# It also allow for completion after fun$... and completion of functions
# arguments, depending on the selected type (to avoid putting all arguments
# for all types together, otherwise, it is a mess)
head2 <- structure(function(data, n = 10, ..., type = "default") {
  # This was the old (static) aaproach: not possible to add a new type
  # without modifying the function head2()
  #switch(type,
  #  default = `.head2$default`(data, n = n, ...),
  #  fun = `.head2$fun`(data, n = n, ...)
  #)
  # This is the new (dynamic) approach
  get_type("head2", type = type)(data, n = n, ...)
}, class = c("subsettable_type", "function", "head2"))

# We define two types for head2(): default and fun
`head2_default` <- function(data, n = 10, ...) {
  head(data, n = n)
}

# Apply a fun on head() - just an example, not necessarily useful
`head2_fun` <- function(data, n = 10, fun = summary, ...) {
  head(data, n = n) |> fun(...)
}

head2(iris)
#>    Sepal.Length Sepal.Width Petal.Length Petal.Width Species
#> 1           5.1         3.5          1.4         0.2  setosa
#> 2           4.9         3.0          1.4         0.2  setosa
#> 3           4.7         3.2          1.3         0.2  setosa
#> 4           4.6         3.1          1.5         0.2  setosa
#> 5           5.0         3.6          1.4         0.2  setosa
#> 6           5.4         3.9          1.7         0.4  setosa
#> 7           4.6         3.4          1.4         0.3  setosa
#> 8           5.0         3.4          1.5         0.2  setosa
#> 9           4.4         2.9          1.4         0.2  setosa
#> 10          4.9         3.1          1.5         0.1  setosa
head2(iris, type = "default") # Idem
#>    Sepal.Length Sepal.Width Petal.Length Petal.Width Species
#> 1           5.1         3.5          1.4         0.2  setosa
#> 2           4.9         3.0          1.4         0.2  setosa
#> 3           4.7         3.2          1.3         0.2  setosa
#> 4           4.6         3.1          1.5         0.2  setosa
#> 5           5.0         3.6          1.4         0.2  setosa
#> 6           5.4         3.9          1.7         0.4  setosa
#> 7           4.6         3.4          1.4         0.3  setosa
#> 8           5.0         3.4          1.5         0.2  setosa
#> 9           4.4         2.9          1.4         0.2  setosa
#> 10          4.9         3.1          1.5         0.1  setosa
head2$default(iris) # Idem
#>    Sepal.Length Sepal.Width Petal.Length Petal.Width Species
#> 1           5.1         3.5          1.4         0.2  setosa
#> 2           4.9         3.0          1.4         0.2  setosa
#> 3           4.7         3.2          1.3         0.2  setosa
#> 4           4.6         3.1          1.5         0.2  setosa
#> 5           5.0         3.6          1.4         0.2  setosa
#> 6           5.4         3.9          1.7         0.4  setosa
#> 7           4.6         3.4          1.4         0.3  setosa
#> 8           5.0         3.4          1.5         0.2  setosa
#> 9           4.4         2.9          1.4         0.2  setosa
#> 10          4.9         3.1          1.5         0.1  setosa
head2$fun(iris) # The other type, with fun = summary()
#>   Sepal.Length    Sepal.Width     Petal.Length   Petal.Width         Species
#>  Min.   :4.400   Min.   :2.900   Min.   :1.30   Min.   :0.10   setosa    :10
#>  1st Qu.:4.625   1st Qu.:3.100   1st Qu.:1.40   1st Qu.:0.20   versicolor: 0
#>  Median :4.900   Median :3.300   Median :1.40   Median :0.20   virginica : 0
#>  Mean   :4.860   Mean   :3.310   Mean   :1.45   Mean   :0.22
#>  3rd Qu.:5.000   3rd Qu.:3.475   3rd Qu.:1.50   3rd Qu.:0.20
#>  Max.   :5.400   Max.   :3.900   Max.   :1.70   Max.   :0.40
head2$fun(iris, fun = str)
#> 'data.frame':	10 obs. of  5 variables:
#>  $ Sepal.Length: num  5.1 4.9 4.7 4.6 5 5.4 4.6 5 4.4 4.9
#>  $ Sepal.Width : num  3.5 3 3.2 3.1 3.6 3.9 3.4 3.4 2.9 3.1
#>  $ Petal.Length: num  1.4 1.4 1.3 1.5 1.4 1.7 1.4 1.5 1.4 1.5
#>  $ Petal.Width : num  0.2 0.2 0.2 0.2 0.2 0.4 0.3 0.2 0.2 0.1
#>  $ Species     : Factor w/ 3 levels "setosa","versicolor",..: 1 1 1 1 1 1 1 1 1 1

# Now, the completion (e.g., in RStudio or Positron)
# 1. Type head2$ and you got the list of available types
# 2. Select "default" then hit <tab>, you got the list of args for default
# 3. Do the same but select "fun", now you got the arguments for the fun type
# 4. Just write a new `.head2_<type>` function and <type> is automatically
#    integrated!
