
Unified Interface (with Formula) for R Plots ![]() ================
================
The {chart} package provides an alternate formula interface to {ggplot2}, and it also homogenize plot outputs from base R plots, {lattice} and {ggplot}. If labels and/or units attributes are defined for variables in the data, they are used automatically to construct the label (with units) of the axes. See https://www.sciviews.org/chart/ for more details.
Installation
{chart} is not available from CRAN yet. You should install it from the SciViews R-Universe. The {data.io} package is useful too because it manages labels and units that {chart} uses. To install those two packages and their dependencies, run the following command in R:
install.packages(c('chart', 'data.io'),
  repos = c('https://sciviews.r-universe.dev', 'https://cloud.r-project.org'))
You can also install the latest development version of {chart}. Make sure you have the {remotes} R package installed:
install.packages("remotes")Use install_github() to install the {chart} package from GitHub (source from main branch will be recompiled on your machine):
remotes::install_github("SciViews/chart")R should install all required dependencies automatically, and then it should compile and install {chart}.
Further explore {chart}
Starting from the airquality from {datasets}, we can annotate our dataset with labels and units for its variable like this:
data(airquality, package = "datasets")
airquality <- data.io::labelise(airquality, label = list(
  Ozone = "Ozone", Temp = "Temperature", Solar.R = "Solar radiation",
  Wind = "Wind speed"
), units = list(
  Ozone = "ppb", Temp = "°F", Solar.R = "lang", Wind = "mph"
))
here is a first {chart}:
library(chart)
chart(airquality, Ozone ~ Solar.R %col=% Temp) +
  geom_point(na.rm = TRUE)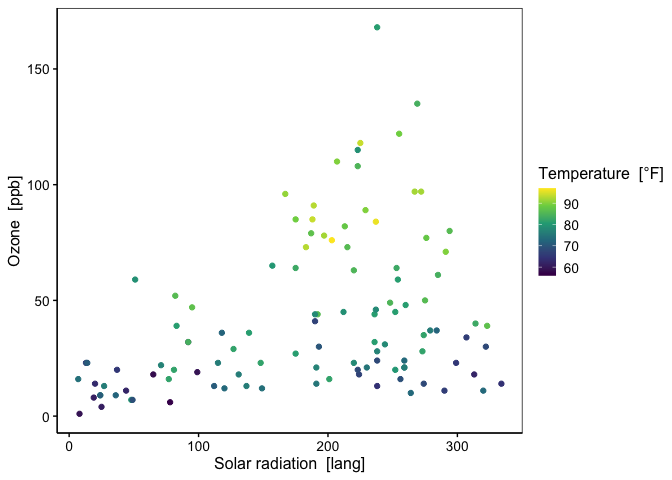
You will notice that the syntax is relatively close to {ggplot2}, except that ggplot() is here replaced by chart() and aes(x = Solar.R, y = Ozone, col = Temp) is replaced by a formula using y ~ x plus an optional series of %<arg>% terms where <arg> is the argument you would use in {ggplot2}’s aes() instruction (the aes() form is also accepted in chart()). The default style is also different and closer to a “publication-ready” version of the plot. Finally, labels and units we defined above in the airquality dataset are automatically used. Of course, you can override these labels with labs() if you want.
chart() is compatible with all {ggplot2} and ggplot2 extensions. It can also be used to create {lattice} or base R plots. Several specialized plots are available through chart() methods and types in separate packages, such as {modelit} and {exploreit}.
For further details, see https://www.sciviews.org/chart/. You can get further help about this package this way:
Code of Conduct
Please note that the {chart} package is released with a Contributor Code of Conduct. By contributing to this project, you agree to abide by its terms.