
Compute and plot a distogram
disto.RdA distogram is an extension of the variogram to a multivariate time-series. It computes, for each observation (with a constant interval h between each observation), the euclidean distance standardized to one (chord distance)
disto(x, max.dist=nrow(x)/4, plotit=TRUE, disto.data=NULL)Arguments
- x
a matrix, a data frame or a multiple time-series
- max.dist
the maximum distance to calculate. By default, it is the third of the number of observations (that is, the number of rows in the matrix)
- plotit
If
plotit=TRUEthen the graph of the distogram is plotted- disto.data
data coming from a previous call to
disto(). Call the function again with these data to plot the corresponding graph
Value
A data frame containing distance and distogram values
References
Dauvin, J.C. & F. Ibanez, 1986. Variations à long-terme (1977-1985) du peuplement des sables fins de la Pierre Noire (baie de Morlaix, Manche Occidentale): analyse statistique de l'évolution structurale. Hydrobiologia, 142:171-186.
Ibanez, F. & J.C. Dauvin, 1988. Long-term changes (1977-1987) in a muddy fine sand Abra alba - Melinna palmate community from the Western English Channel: multivariate time-series analysis. Mar. Ecol. Prog. Ser., 49:65-81.
Mackas, D.L., 1984. Spatial autocorrelation of plankton community composition in a continental shelf ecosystem. Limnol. Ecol., 20:451-471.
See also
Examples
data(bnr)
disto(bnr)
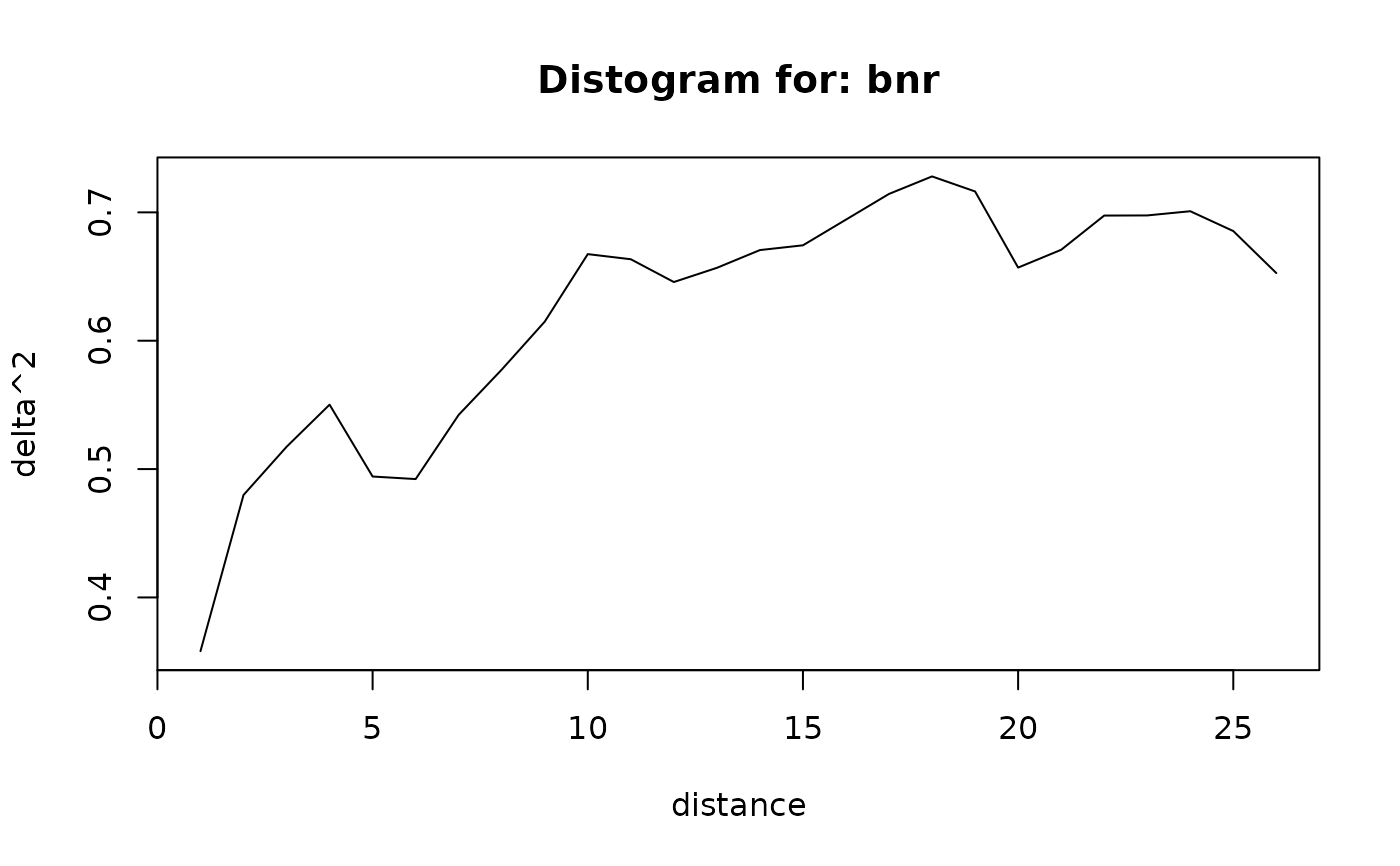 #> distance distogram
#> 1 1 0.3581454
#> 2 2 0.4797966
#> 3 3 0.5173366
#> 4 4 0.5501900
#> 5 5 0.4942032
#> 6 6 0.4922207
#> 7 7 0.5422460
#> 8 8 0.5774747
#> 9 9 0.6148662
#> 10 10 0.6674661
#> 11 11 0.6634647
#> 12 12 0.6457200
#> 13 13 0.6567708
#> 14 14 0.6706163
#> 15 15 0.6743301
#> 16 16 0.6943444
#> 17 17 0.7143640
#> 18 18 0.7279900
#> 19 19 0.7162906
#> 20 20 0.6569722
#> 21 21 0.6708284
#> 22 22 0.6974970
#> 23 23 0.6976051
#> 24 24 0.7008844
#> 25 25 0.6854326
#> 26 26 0.6526971
#> distance distogram
#> 1 1 0.3581454
#> 2 2 0.4797966
#> 3 3 0.5173366
#> 4 4 0.5501900
#> 5 5 0.4942032
#> 6 6 0.4922207
#> 7 7 0.5422460
#> 8 8 0.5774747
#> 9 9 0.6148662
#> 10 10 0.6674661
#> 11 11 0.6634647
#> 12 12 0.6457200
#> 13 13 0.6567708
#> 14 14 0.6706163
#> 15 15 0.6743301
#> 16 16 0.6943444
#> 17 17 0.7143640
#> 18 18 0.7279900
#> 19 19 0.7162906
#> 20 20 0.6569722
#> 21 21 0.6708284
#> 22 22 0.6974970
#> 23 23 0.6976051
#> 24 24 0.7008844
#> 25 25 0.6854326
#> 26 26 0.6526971